Remove segment around label/text in ggplot2
Asked Answered
T

3

5

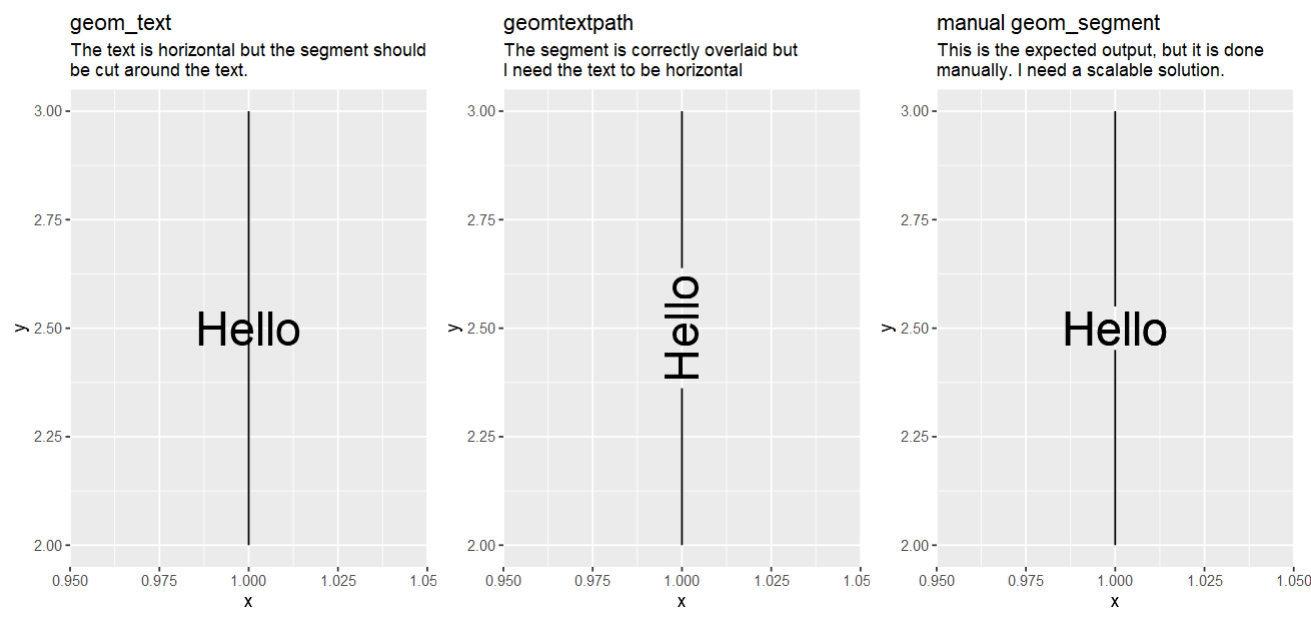
Consider a plot with a segment/line and a text/label. I'd like the text to overlay the segment such that the text does not overlap the segment.

I tried using geom_label but I still want the background to be the same, just the other objects to be removed around the text. I also tried with geomtextpath but couldn't get the text to be horizontal. Any ideas?

seg <- data.frame(x = 1, xend = 1, y = 2, yend = 3)
plot1 <- ggplot(seg) +
  aes(x = x, xend = xend, y = y, yend = yend) +
  geom_segment() +
  geom_text(aes(y = (y + yend) / 2), label = "Hello", size = 10) +
  labs(title = "geom_text", 
       subtitle = "The text is horizontal but the segment should\nbe cut around the text.")

library(geomtextpath)
plot2 <- ggplot(seg) +
  aes(x = x, xend = xend, y = y, yend = yend) +
  geom_textsegment(label = "Hello", size = 10) +
  labs(title = "geomtextpath",
       subtitle = "The segment is correctly overlaid but\nI need the text to be horizontal")

seg2 <- data.frame(x = c(1, 1), xend = c(1, 1), y = c(2, 2.55), yend = c(2.45, 3))
plot3 <- ggplot(seg2) +
  aes(x = x, xend = xend, y = y, yend = yend) +
  geom_segment() +
  geom_text(aes(y = 2.5), label = "Hello", size = 10) +
  labs(title = "manual geom_segment", 
       subtitle = "This is the expected output, but it is done\nmanually. I need a scalable solution.")

library(patchwork)
plot1 + plot2 + plot3

enter image description here

Trishatriskelion answered 14/10, 2022 at 19:1 Comment(0)
N
5

Without writing a new Geom ggproto object (or adding this as a feature to geomtextpath), it will be difficult to get a fully functional geom layer. However, we can use geomtextpath to generate the broken line by making its text invisible, and getting the height of the break correct by shrinking the invisible text according to its width:height ratio. Then we just add a text label in the middle.

Note that this means the x, y, xend, yend and label need to be passed rather than being mapped as aesthetics, so it acts more like an annotation layer than a true geom layer:

library(geomtextpath)
#> Loading required package: ggplot2

geom_segment_text <- function(label = NULL, data = NULL, mapping = NULL,
                              inherit.aes = TRUE, x, xend, y, yend, ...,
                              size = 11/.pt, linecolour = "black") {
  
  df <- data.frame(x = x, y = y, xend = xend, yend = yend, label = label)
  ts <- textshaping::shape_text(label)$metric
  ratio <- ts$height / ts$width * 0.6
  list(
    geom_segment(aes(x, y, xend = xend, yend = yend), data = df, colour = NA),
    layer(geom = "text", stat = "identity", data = df, 
          mapping = aes((x + xend)/2, (y + yend)/2, label = label),
          position = "identity",
          params = list(size = size, ...), inherit.aes = inherit.aes),
    layer(geom = "textsegment", stat = "identity", data = df, 
          mapping = aes(x, y, xend = xend, yend = yend, label = label),
          position = "identity",
          params = list(colour = NA, size = size * ratio, 
                        linecolour = linecolour, padding = unit(0, "mm"), ...),
          inherit.aes = inherit.aes)
  )
}

This allows:

ggplot() +
  geom_segment_text(label = "Hello", size = 10, x = 1, y = 2, xend = 1, yend = 3)

We can see that the line breaks scale appropriately if the text size is changed. Crucially, because we are using geomtextpath, the spacing of the lines around the text remain constant if the image is resized:

ggplot() +
  geom_segment_text(label = "Hello", size = 20, x = 1, y = 2, xend = 1, yend = 3)

Created on 2022-10-18 with reprex v2.0.2

Neurology answered 18/10, 2022 at 21:44 Comment(0)
F
5

I wouldn't say the following is 'easy', but you can use the {ggfx} package to put an inverted mask on the segment that corresponds with a textbox.

library(ggplot2)
library(ggfx)

seg <- data.frame(x = 1, xend = 1, y = 2, yend = 3)

ggplot(seg) +
  aes(x = x, xend = xend, y = y, yend = yend) +
  # Adding a label-textbox as mask ensures appropriate window-agnostic size
  # Just make sure the aesthetics are the same as the geom_text later
  as_reference(
    geom_label(aes(y = (y + yend) / 2), label = "Hello", size = 10),
    id = "textbox"
  ) +
  # Plot the masked bit
  with_mask(
    geom_segment(),
    mask = ch_alpha("textbox"), invert = TRUE
  ) +
  # On top of the mask
  geom_text(aes(y = (y + yend) / 2), label = "Hello", size = 10)

Created on 2022-10-14 by the reprex package (v2.0.1)

EDIT:

Somewhat more generalisable function. Note however that this option requires you to set the aesthetics in the function.

library(ggplot2)
library(ggfx)

geom_text_segment <- function(mapping, ...) {

  # Divide up the mapping to the segment and text
  segment_mapping <- mapping
  segment_mapping$label <- NULL
  segment_mapping$xmiddle <- segment_mapping$ymiddle <- NULL
  
  text_mapping <- mapping
  text_mapping$yend <- text_mapping$xend <- NULL
  text_mapping$y <- text_mapping$ymiddle
  text_mapping$x <- text_mapping$xmiddle
  text_mapping$xmiddle <- text_mapping$ymiddle <- NULL
  
  list(
    as_reference(
      geom_label(text_mapping, ...),
      id = "textbox"
    ),
    with_mask(
      geom_segment(segment_mapping, ...),
      mask = ch_alpha("textbox", invert = TRUE)
    ),
    geom_text(text_mapping)
  )
}

Example:

seg <- data.frame(
  xstart = c(0, 1),
  xend   = c(2, 1),
  ystart = c(0.7, 0),
  yend   = c(0.7, 1),
  label  = c("First", "Second")
)

ggplot(seg) +
  geom_text_segment(
    aes(x = xstart, xend = xend, y = ystart, yend = yend, 
        xmiddle = (xstart + xend) / 2,
        ymiddle = (ystart + yend) / 2,
        label = label)
  )

Created on 2022-10-17 by the reprex package (v2.0.1)

You can edit the function as you see fit. If you want to pass label.padding to the geom_label() part (to control how much segment is removed), you can just add that as an argument to the function and forward it to geom_label(). You could keep adding in all layer-specific functionality until it fits your needs, but I'm here to answer questions, not to develop a package to-go.

Floriaflorian answered 14/10, 2022 at 19:36 Comment(3)
Thank you! Do you think there’s a way to generalize that to a geom object?Shem
A straightforward path to generalise this to a single layer doesn't seem easily come to mind.Floriaflorian
I've posted a convoluted path in the edit.Floriaflorian
N
5

Without writing a new Geom ggproto object (or adding this as a feature to geomtextpath), it will be difficult to get a fully functional geom layer. However, we can use geomtextpath to generate the broken line by making its text invisible, and getting the height of the break correct by shrinking the invisible text according to its width:height ratio. Then we just add a text label in the middle.

Note that this means the x, y, xend, yend and label need to be passed rather than being mapped as aesthetics, so it acts more like an annotation layer than a true geom layer:

library(geomtextpath)
#> Loading required package: ggplot2

geom_segment_text <- function(label = NULL, data = NULL, mapping = NULL,
                              inherit.aes = TRUE, x, xend, y, yend, ...,
                              size = 11/.pt, linecolour = "black") {
  
  df <- data.frame(x = x, y = y, xend = xend, yend = yend, label = label)
  ts <- textshaping::shape_text(label)$metric
  ratio <- ts$height / ts$width * 0.6
  list(
    geom_segment(aes(x, y, xend = xend, yend = yend), data = df, colour = NA),
    layer(geom = "text", stat = "identity", data = df, 
          mapping = aes((x + xend)/2, (y + yend)/2, label = label),
          position = "identity",
          params = list(size = size, ...), inherit.aes = inherit.aes),
    layer(geom = "textsegment", stat = "identity", data = df, 
          mapping = aes(x, y, xend = xend, yend = yend, label = label),
          position = "identity",
          params = list(colour = NA, size = size * ratio, 
                        linecolour = linecolour, padding = unit(0, "mm"), ...),
          inherit.aes = inherit.aes)
  )
}

This allows:

ggplot() +
  geom_segment_text(label = "Hello", size = 10, x = 1, y = 2, xend = 1, yend = 3)

We can see that the line breaks scale appropriately if the text size is changed. Crucially, because we are using geomtextpath, the spacing of the lines around the text remain constant if the image is resized:

ggplot() +
  geom_segment_text(label = "Hello", size = 20, x = 1, y = 2, xend = 1, yend = 3)

Created on 2022-10-18 with reprex v2.0.2

Neurology answered 18/10, 2022 at 21:44 Comment(0)
C
2

Edit

Here is a more generalized option. The size of your text is in mm and you can specify the size in points by dividing it by the constant .pt. So you could calculate the actual size in your values by saying (size/100)/.pt to get the actual height of your text. You could add a small value to make the distance slightly bigger. Here is a reproducible example using a size of 10 and 20:

seg <- data.frame(x = 1, xend = 1, y = 2, yend = 3)
y_mid <- mean(c(seg$y, seg$yend))

library(ggplot2)
library(dplyr)

size_val = 10

p <- ggplot(seg) +
  aes(x = x, xend = xend, y = y, yend = yend) +
  geom_segment() +
  geom_text(aes(y = (y + yend) / 2), label = "Hello", size = size_val)

q <- ggplot_build(p)

q$data[[1]] <- q$data[[1]] %>%
  bind_rows(q$data[[1]]) %>%
  mutate(y = c(first(y), y_mid + (size_val/100)/.pt),
         yend = c(y_mid - (size_val/100)/.pt, last(yend)))

q <- ggplot_gtable(q)

plot(q)

size_val = 20

p <- ggplot(seg) +
  aes(x = x, xend = xend, y = y, yend = yend) +
  geom_segment() +
  geom_text(aes(y = (y + yend) / 2), label = "Hello", size = size_val)

q <- ggplot_build(p)

q$data[[1]] <- q$data[[1]] %>%
  bind_rows(q$data[[1]]) %>%
  mutate(y = c(first(y), y_mid + (size_val/100)/.pt),
         yend = c(y_mid - (size_val/100)/.pt, last(yend)))

q <- ggplot_gtable(q)

plot(q)

Created on 2022-10-17 with reprex v2.0.2


An option could be using ggplot_build to modify the distance of your geom_segment by creating two separate segments like this:

seg <- data.frame(x = 1, xend = 1, y = 2, yend = 3)

library(ggplot2)
library(dplyr)
p <- ggplot(seg) +
  aes(x = x, xend = xend, y = y, yend = yend) +
  geom_segment() +
  geom_text(aes(y = (y + yend) / 2), label = "Hello", size = 10)

q <- ggplot_build(p)

q$data[[1]] <- q$data[[1]] %>%
  bind_rows(q$data[[1]]) %>%
  mutate(y = c(2, 2.55),
         yend = c(2.45, 3))

q <- ggplot_gtable(q)

plot(q)

Created on 2022-10-15 with reprex v2.0.2

Cythera answered 15/10, 2022 at 8:43 Comment(1)
Hi @Maël, I added a slightly more generalized option using the constant .pt to know the actual height of your label to modify the segments.Cythera

© 2022 - 2025 — McMap. All rights reserved.