Compromise between quality and file size, how to save a very detailed image into a file with reasonable size (<1MB)?
Asked Answered
L

3

5

I am facing a small (big) problem: I want to generate a high resolution speckle pattern and save it as a file that I can import into a laser engraver. Can be PNG, JPEG, PDF, SVG, or TIFF.

My script does a decent job of generating the pattern that I want:

The user needs to first define the inputs, these are:

############
#  INPUTS  #
############
dpi = 1000 # dots per inch
dpmm = 0.03937 * dpi # dots per mm
widthOfSampleMM = 50 # mm
heightOfSampleMM = 50 # mm
patternSizeMM = 0.1 # mm
density = 0.75 # 1 is very dense, 0 is not fine at all
variation = 0.75 # 1 is very bad, 0 is very good
############

After this, I generate the empty matrix and fill it with black shapes, in this case a circle.

# conversions to pixels
widthOfSamplesPX = int(np.ceil(widthOfSampleMM*dpmm)) # get the width
widthOfSamplesPX = widthOfSamplesPX + 10 - widthOfSamplesPX % 10 # round up the width to nearest 10
heightOfSamplePX = int(np.ceil(heightOfSampleMM*dpmm)) # get the height
heightOfSamplePX = heightOfSamplePX + 10 - heightOfSamplePX % 10 # round up the height to nearest 10
patternSizePX = patternSizeMM*dpmm # this is the size of the pattern, so far I am going with circles
# init an empty image
im = 255*np.ones((heightOfSamplePX, widthOfSamplesPX), dtype = np.uint8)
# horizontal circle centres
numPoints = int(density*heightOfSamplePX/patternSizePX) # get number of patterns possible
if numPoints==1:
    horizontal = [heightOfSamplePX // 2]
else:
    horizontal = [int(i * heightOfSamplePX / (numPoints + 1)) for i in range(1, numPoints + 1)]
# vertical circle centres
numPoints = int(density*widthOfSamplesPX/patternSizePX)
if numPoints==1:
    vertical = [widthOfSamplesPX // 2]
else:
    vertical = [int(i * widthOfSamplesPX / (numPoints + 1)) for i in range(1, numPoints + 1)]
for i in vertical:
    for j in horizontal:
        # generate the noisy information
        iWithNoise = i+variation*np.random.randint(-2*patternSizePX/density, +2*patternSizePX/density)
        jWithNoise = j+variation*np.random.randint(-2*patternSizePX/density, +2*patternSizePX/density)
        patternSizePXWithNoise = patternSizePX+patternSizePX*variation*(np.random.rand()-0.5)/2
        cv2.circle(im, (int(iWithNoise),int(jWithNoise)), int(patternSizePXWithNoise//2), 0, -1) # add circle

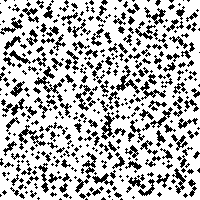
After this step, I can get im, here's a low quality example at dpi=1000:

bad example

And here's one with my target dpi (5280):

good example

Now I would like to save im in a handlable way at high quality (DPI>1000). Is there any way to do this?


Stuff that I have tried so far:

  1. plotting and saving the plot image with PNG, TIFF, SVG, PDF with different DPI values plt.savefig() with different dpi's
  2. cv2.imwrite() too large of a file, only solution here is to reduce DPI, which also reduces quality
  3. SVG write from matrix: I developed this function but ultimately, the files were too large:
import svgwrite
def matrix_to_svg(matrix, filename, padding = 0, cellSize=1):
    # get matrix dimensions and extremes
    rows, cols = matrix.shape
    minVal = np.min(matrix)
    maxVal = np.max(matrix)
    # get a drawing
    dwg = svgwrite.Drawing(filename, profile='tiny', 
                           size = (cols*cellSize+2*padding,rows*cellSize+2*padding))
    # define the colormap, in this case grayscale since black and white
    colorScale = lambda val: svgwrite.utils.rgb(int(255*(val-minVal)/(maxVal-minVal)),
                                                 int(255*(val-minVal)/(maxVal-minVal)),
                                                 int(255*(val-minVal)/(maxVal-minVal)))
    # get the color of each pixel in the matrix and draw it
    for i in range(rows):
        for j in range(cols):
            color = colorScale(matrix[i, j])
            dwg.add(dwg.rect(insert=(j * cellSize + padding, i * cellSize + padding),
                             size=(cellSize, cellSize),
                             fill=color))
    dwg.save() # save
  1. PIL.save(). Files too large

The problem could be also solved by generating better shapes. This would not be an obstacle either. I am open to re-write using a different method, would be grateful if someone would just point me in the right direction.

Latinist answered 18/7 at 8:52 Comment(18)
Define "reasonable size" and "too large" (and whatever other subjective descriptions you have in the post). And remember that metacommentary such as "thanks in advance" doesn't belong in questions.Blest
If my math is right, you want to have at least 400 pixels per mm (i.e. 160 thousand pixels per square mm) and have this for a 50 mm square (so 2500 square mm).... so 400 megapixel image or larger?Blest
How specifically does the size become a problem?Blest
Hey, thanks for the comments. I adjusted the post and your calculations are correct. The file size becomes a problem when importing it into the laser engraver. It cannot handle big files well and becomes very slow, sometimes doesn't import it at all. The laser engraver can also work with PDF or SVGs. @DanMašekLatinist
Hmm, so it's really about the raw pixel count (product of DPI and physical size) that seems to be the limiting factor. In which case it doesn't matter if it's PNG, JPG, TIFF or any other raster format. | I wonder what it does with the vector files internally... wouldn't be surprised if it rasterized them, at which point we're back to where we started, and the file format doesn't really matter.Blest
However, looking at the SVG generation, it looks like you're just drawing a grid of rectangles, one per each pixel, and oh dear I don't want to imagine the size of that on disk. I would have expected to have circles, one for each of the spots you generated earlier (and let the SVG renderer turn them into pixels at whatever resolution is needed). A proper vector image, you know.Blest
thanks for the comment. I could have used the function to transform the matrix to svg to actually draw the svg from the beginning. I'm re-writing and the image is now within 1 MB at the DPI I want :DLatinist
@DanMašek do post it as an answer, you made me see something that I couldn't beforeLatinist
I'm glad you're no longer generating SVGs that consist of pixels.Mo
Detail and file size are a conjugate pair. Small files imply less data and highly compressible source material. Random bit patterns are almost incompressible. The best compression for your nearly random speckle data is most likely the sourcecode for the generating algorithm and run it at the destination. Requiring a <1MB file seems unduly restrictive these days when big disks and USB sticks are so cheap. A set of well chosen affine transform fractal rules might be able to do exactly what you want.Hysterics
@MartinBrown nice recommendations. The laser engraver has a very limited UI and cannot do all of these things. If it was possible, this would be a nie solution indeedLatinist
Can you tell the laser engraver to tile the plane with rotations and/or flips of the original file? That might just be enough to fool the eye into not seeing the boundaries. Adjacent tiles with reflection symmetry would be too obvious.Hysterics
if you want to squeeze the SVG more, truncate the floating point values. if they're sourced from randomness, they'll likely take up 8-16 decimals. if it's integers however, you'll be fine.Mo
@MartinBrown no, the laser just let's you import image data, it can be done in Gimp for example beforehand though... here we might lose quality or get higher file sizes as wellLatinist
@ChristophRackwitz thanks for the recommendation, I'll look into it :DLatinist
@KJ this looks quite, how did you do it?Latinist
@TinoD Made some more tweaks and updated the answer. Thanks for a fun excercise :) (BTW, next time a better MCVE wouldn't hurt, it took some time to iron out the inconsistencies (e.g. WidthOfSample_mm vs widthOfSampleMM) and eliminate some of the copy-pasta ;))Blest
@DanMašek I think I copy pasted the first section, adjusted the text on the other and then posted the question 😅 Sorry for that, will correct it in the questionLatinist
T
7

Let's make some observations of the effects of changing the DPI:

DPI 1000   Height=1970   Width=1970    # Spots=140625  Raw pixels: 3880900
DPI 10000  Height=19690  Width=19690   # Spots=140625  Raw pixels: 387696100

We can see that while the number of spots drawn remains quite consistent (it does vary due to the various rounding in your calculations, but for all intents and purposes, we can consider it constant), the raw pixel count of a raster image generated increases quadratically. A vector representation would seem desireable, since it is freely scalable (quality depending on the capabilities of a renderer).

Unfortunately, the way you generate the SVG is flawed, since you've basically turned it into an extremely inefficient raster representation. This is because you generate a rectangle for each individual pixel (even for those that are technically background). Consider that in an 8-bit grayscale image, such as the PNGs you generate requires 1 byte to represent a raw pixel. On the other hand, your SVG representation of a single pixel looks something like this:

<rect fill="rgb(255,255,255)" height="1" width="1" x="12345" y="15432" />

Using ~70 bytes per pixel, when we're talking about tens of megapixels... clearly not the way to go.

However, let's recall that the number of spots doesn't depend on DPI. Can we just represent the spots in some efficient way? Well, the spots are actually circles, parametrized by position, radius and colour. SVG supports circles, and their representation looks like this:

<circle cx="84" cy="108" fill="rgb(0,0,0)" r="2" />

Let's look at the effects of changing the DPI now.

DPI 1000   # Spots=140625  Raw pixels: 3880900    SVG size: 7435966
DPI 10000  # Spots=140625  Raw pixels: 387696100  SVG size: 7857942

The slight increase in size is due to increased range of position/radius values.


I somewhat refactored your code example. Here's the result that demonstrates the SVG output.

import numpy as np
import cv2
import svgwrite

MM_IN_INCH = 0.03937

def round_int_to_10s(value):
    int_value = int(value)
    return int_value + 10 - int_value % 10

def get_sizes_pixels(height_mm, width_mm, pattern_size_mm, dpi):
    dpmm = MM_IN_INCH * dpi # dots per mm
    width_px = round_int_to_10s(np.ceil(width_mm * dpmm))
    height_px = round_int_to_10s(np.ceil(height_mm * dpmm))
    pattern_size_px = pattern_size_mm * dpmm
    return height_px, width_px, pattern_size_px
 
def get_grid_positions(size, pattern_size, density):
    count = int(density * size / pattern_size) # get number of patterns possible
    if count == 1:
        return [size // 2]
    return [int(i * size / (count + 1)) for i in range(1, count + 1)]
 
def get_spot_grid(height_px, width_px, pattern_size_px, density):
    vertical = get_grid_positions(height_px, pattern_size_px, density)
    horizontal = get_grid_positions(width_px, pattern_size_px, density)
    return vertical, horizontal

def generate_spots(vertical, horizontal, pattern_size, density, variation):
    spots = []
    noise_halfspan = 2 * pattern_size / density;
    noise_min, noise_max = (-noise_halfspan, noise_halfspan)
    for i in vertical:
        for j in horizontal:
            # generate the noisy information
            center = tuple(map(int, (j, i) + variation * np.random.randint(noise_min, noise_max, 2)))
            d = int(pattern_size + pattern_size * variation * (np.random.rand()-0.5) / 2)
            spots.append((center, d//2)) # add circle params
    return spots

def render_raster(height, width, spots):
    im = 255 * np.ones((height, width), dtype=np.uint8)
    for center, radius in spots:
        cv2.circle(im, center, radius, 0, -1) # add circle
    return im
    
def render_svg(height, width, spots):
    dwg = svgwrite.Drawing(profile='tiny', size = (width, height))
    fill_color = svgwrite.utils.rgb(0, 0, 0)
    for center, radius in spots:
        dwg.add(dwg.circle(center, radius, fill=fill_color)) # add circle
    return dwg.tostring()


#  INPUTS  #
############
dpi = 100 # dots per inch
WidthOfSample_mm = 50 # mm
HeightOfSample_mm = 50 # mm
PatternSize_mm = 1 # mm
density = 0.75 # 1 is very dense, 0 is not fine at all
Variation = 0.75 # 1 is very bad, 0 is very good
############

height, width, pattern_size = get_sizes_pixels(HeightOfSample_mm, WidthOfSample_mm, PatternSize_mm, dpi)
vertical, horizontal = get_spot_grid(height, width, pattern_size, density)
spots = generate_spots(vertical, horizontal, pattern_size, density, Variation)

img = render_raster(height, width, spots)
svg = render_svg(height, width, spots)

print(f"Height={height}  Width={width}   # Spots={len(spots)}")
print(f"Raw pixels: {img.size}")
print(f"SVG size: {len(svg)}")

cv2.imwrite("timo.png", img)
with open("timo.svg", "w") as f:
    f.write(svg)

This generates the following output:

PNG PNG | Rendered SVG Rendered SVG

Note: Since it's not possible to upload SVGs here, I put it on pastebin, and provide capture of it rendered by Firefox.


Further improvements to the size of the SVG are possible. For example, we're currently using the same colour over an over. Styling or grouping should help remove this redundancy.

Here's an example that groups all the spots in one group with constant fill colour:

def render_svg(height, width, spots):
    dwg = svgwrite.Drawing(profile='tiny', size = (width, height))
    dwg_spots = dwg.add(dwg.g(id='spots', fill='black'))
    for center, radius in spots:
        dwg_spots.add(dwg.circle(center, radius)) # add circle
    return dwg.tostring()

The output looks the same, but the file is now 4904718 bytes instead of 7435966 bytes.

An alternative (pointed out by AKX) if you only desire to draw in black, you may omit the fill specification as well as the grouping, since the default SVG fill colour is black.


The next thing to notice is that most of the spots have the same radius -- in fact, using your settings at DPI of 1000 the unique radii are [1, 2] and at DPI of 10000 they are [15, 16, 17, 18, 19, 20, 21, 22, 23].

How could we avoid repeatedly specifying the same radius? (As far as I can tell, we can't use groups to specify it) In fact, how can we omit repeatedly specifying it's a circle? Ideally we'd just tell it "Draw this mark at all of those positions" and just provide a list of points.

Turns out there are two features of SVG that let us do exactly that. First of all, we can specify custom markers, and later refer to them by an ID.

<marker id="id1" markerHeight="2" markerWidth="2" refX="1" refY="1">
  <circle cx="1" cy="1" fill="black" r="1" />
</marker>

Second, the polyline element can optionally draw markers at every vertex of the polyline. If we draw the polyline with no stroke and no fill, all we end up is with the markers.

<polyline fill="none" marker-end="url(#id1)" marker-mid="url(#id1)" marker-start="url(#id1)"
  points="2,5 8,22 11,26 9,46 8,45 2,70 ... and so on" stroke="none" />

Here's the code:

def group_by_radius(spots):
    radii = set([r for _,r in spots])
    groups = {r: [] for r in radii}
    for c, r in spots:
        groups[r].append(c)
    return groups

def render_svg_v2(height, width, spots):
    dwg = svgwrite.Drawing(profile='full', size=(width, height))
    by_radius = group_by_radius(spots)
    dwg_grp = dwg.add(dwg.g(stroke='none', fill='none'))
    for r, centers in by_radius.items():
        dwg_marker = dwg.marker(id=f'r{r}', insert=(r, r), size=(2*r, 2*r))
        dwg_marker.add(dwg.circle((r, r), r=r))
        dwg.defs.add(dwg_marker)
        dwg_line = dwg_grp.add(dwg.polyline(centers))
        dwg_line.set_markers((dwg_marker, dwg_marker, dwg_marker))
    return dwg.tostring()

The output SVG still looks the same, but now the filesize at DPI of 1000 is down to 1248852 bytes.


With high enough DPI, a lot of the coordinates will be 3, 4 or even 5 digits. If we bin the coordinates into tiles of 100 or 1000 pixels, we can then take advantage of the use element, which lets us apply an offset to the referenced object. Thus, we can limit the polyline coordinates to 2 or 3 digits at the cost of some extra overhead (which is generally worth it).

Here's an initial (clumsy) implementation of that:

def bin_points(points, bin_size):
    bins = {}
    for x,y in points:
        bin = (max(0, x // bin_size), max(0, y // bin_size))
        base = (bin[0] * bin_size, bin[1] * bin_size)
        offset = (x - base[0], y - base[1])
        if base not in bins:
            bins[base] = []
        bins[base].append(offset)
    return bins

def render_svg_v3(height, width, spots, bin_size):
    dwg = svgwrite.Drawing(profile='full', size=(width, height))
    by_radius = group_by_radius(spots)
    dwg_grp = dwg.add(dwg.g(stroke='none', fill='none'))
    polyline_counter = 0
    for r, centers in by_radius.items():
        dwg_marker = dwg.marker(id=f'm{r}', insert=(r, r), size=(2*r, 2*r))
        dwg_marker.add(dwg.circle((r, r), r=r, fill='black'))
        dwg.defs.add(dwg_marker)
       
        dwg_marker_grp = dwg_grp.add(dwg.g())
        marker_iri = dwg_marker.get_funciri()
        for kind in ['start','end','mid']:
            dwg_marker_grp[f'marker-{kind}'] = marker_iri
        
        bins = bin_points(centers, bin_size)
        for base, offsets in bins.items():
            dwg_line = dwg.defs.add(dwg.polyline(id=f'p{polyline_counter}', points=offsets))
            polyline_counter += 1            
            dwg_marker_grp.add(dwg.use(dwg_line, insert=base))
    return dwg.tostring()

With bin size set to 100, and DPI of 1000, we get to a file size of 875012 bytes, which means about 6.23 bytes per spot. That's not so bad for XML based format. With DPI of 10000 we need bin size of 1000 to make a meaningful improvement, which yields something like 1349325 bytes (~9.6B/spot).

Turrell answered 18/7 at 12:28 Comment(5)
Isn't the default fill color of SVGs black anyway? The whole fill attribute could likely be elided...Stramonium
@Stramonium True, good catch I'll add it to the answer. Although compared to using the group it's only ~30 characters less.Blest
There are few more minor tweaks that could be probably done to shave a small amount, but at this point I really ought to get to real work :DBlest
@DanMašek thank you so much Dan, I worked on a script based on your answer and it is working very well. In case something gets published, I'll reach out to give you credit. Have a nice Friday and a nice weekend thereafter :DLatinist
I know comments are not supposed to be used for complimenting, but this is indeed a wonderful answer. Eat this ChatGPT... 😀Epps
A
5

You can use 1 bit per pixel TIFF with Group4 Fax compression. For 9842x9842 image (5000 dpi) file size is about 1Mb. (~0.09 bit per pixel)

from PIL import Image, ImageDraw
from random import randint
dpi = 5000  # dots per inch
dpmm = 0.03937 * dpi  # dots per mm
widthOfSampleMM = 50  # mm
heightOfSampleMM = 50  # mm
patternSizeMM = 0.1  # mm
sz = (int(widthOfSampleMM*dpmm), int(heightOfSampleMM*dpmm))
numPoints = 140625
im = Image.new('1', sz, 'white')
draw = ImageDraw.Draw(im)
for i in range(numPoints):
    r = randint(0, int(patternSizeMM*dpmm))
    x = randint(0, sz[0])
    y = randint(0, sz[1])
    draw.ellipse(((x, y), (x+r, y+r)), fill='black')
im.save('test.tif', compression='group4')
Azores answered 19/7 at 7:37 Comment(2)
This is also awesome! I'll read up a bit on these compression methods, do you have any recommendations? should I just check pillow documentation?Latinist
Compression might be a bit deceiving in this use case. It might be small on disk, but whatever device wants to work with it will need to decompress it. And then it's a question of how smart it is in doing so, but at high enough resolutions even at 1bpp it might need too much.Blest
S
0

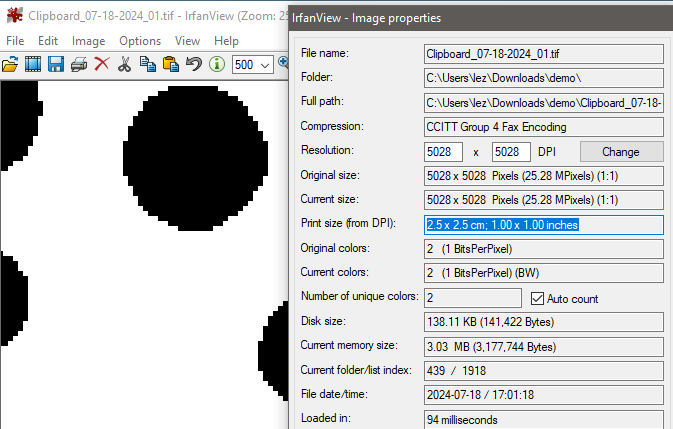
The advantage of image in PDF is each pixel when seen as default is much like a vector square. We can see that by zoom in on the described target 5028x5028 image.

Here tested as Monochrome best Tiff compression. It will be 138 KB well within desired 1 MB as it is compressed like a FAX. But there some other compressions that are more effective in PDF. The main decision is how to use an application to inject as a "Paged" object. Python tends to use ImageMagick (with Ghostscript) or Pillow which are not always the most compressive route. However in this case it should work well. What is not well known in that Acrobat Reader can be triggered into applying Adobe based compression and I used a "Save AS" in Adobe Reader to get an initially "Larger" output, then recompressed that. However TIFF should be good enough.

enter image description here

Unfortunately it was so well compressed in the PDF by Acrobat Reader it is not accepted here as a valid image! So a few screenshots.
Page size is 72 points = a default 1 inch. Remember, a PDF has no concept of DPI but I assure you there are 5028 dots in both X & Y directions.

enter image description here

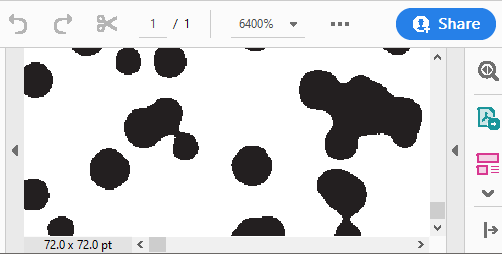
Let's zoom in to the Maximum Zoom = 6400%. And the randomised blobs are fairly good with no visible "Halo" artifacts nor significantly "Aliased" edges. Of course it will not be as regular or smooth as a circular vector pattern unless adding AntiAlias Grey colouration. That is all done in 96.5 KB, far less than the bytes needed to describe a few PDF circles. By targetting a range of compressors it can be reduced to 10 KB but the time taken is not desirable and the more you compress, the disproportionate time to read by decompression. Hence FAX speed is an optimal balance.

In a PDF the SVG description of a circle must be converted into a minimum of 4 quadrant curves thus the smallest PDF circle description is longer than it will be in an SVG.

enter image description here

ONE small SVG circle, as saved from a browser "Save As PDF". The vector starts with a move here to 46 59 (short and sweet) but then it wastes a horrendous amount of bytes drawing the rounded edges like a threepenny piece but with 16 edges. Gzip compression will help but it's nowhere near as effective as pixel compression.

You can see this one is 2 units radius as it's bound by 42 57 to 46 61 and returns to 46 59.

46 59 m
45.999998 59.265214 45.94925 59.520334 45.847757 59.76536 c
45.74626 60.010389 45.60175 60.22667 45.414216 60.41421 c
45.226675 60.601747 45.01039 60.746259 44.76536 60.847757 c
44.520334 60.94925 44.265214 60.999998 44 61 c

43.73478 60.999998 43.479658 60.94925 43.234628 60.847757 c
42.989599 60.746259 42.77332 60.601747 42.585786 60.41421 c
42.398248 60.22667 42.25373 60.010389 42.152238 59.765359 c
42.050745 59.520334 41.999998 59.265214 42 59 c

41.999998 58.734785 42.050745 58.47966 42.152238 58.23463 c
42.25373 57.9896 42.398248 57.773317 42.585786 57.58578 c
42.77332 57.398248 42.989599 57.25373 43.234628 57.152238 c
43.479658 57.050748 43.73478 57 44 57 c

44.265214 57 44.520334 57.050748 44.76536 57.152238 c
45.01039 57.25373 45.226675 57.398248 45.414216 57.58578 c
45.60175 57.773317 45.74626 57.989599 45.847757 58.234628 c
45.94925 58.479658 45.999998 58.734785 46 59 c
h
f

We can use the PDF native description of vector circles, but each will still be over 100 bytes.

enter image description here

To keep within the 1,000,000 byte requirement we would be limited to less than 10,000 as a potential maximum, and the more complex the spread, the far less could then be accommodated.

Vector circles in PDF certainly do have their uses, but need to be used sparingly.

A pattern of a limited number can be easily tiled repeatedly, in a more effective way. But for a totally random layout it's a phenomenal amount of data. Usually pure vector drawings take a lot of time converting back from PDF to screen pixels.

As pixels LoadDocument: 104.86 ms.
As vectors Slow rendering: 214.33 ms, page: 1.
Thus about twice as long in a crude test.

Sturgill answered 18/7 at 17:47 Comment(5)
Just out of curiosity, how many spots/circles do you have drawn there (as compared to my tests with 140625 of them)? Just so that we compare apples to apples :) Obviously PDF is not XML like SVG and has much terser representation, not to mention compression, so even as a pure vector drawing I'd expect it to win.Blest
Of course, the money question is, how exactly do you generate those PDFs? I'm having hard time finding that from your answer at this time.Blest
As Dan mentioned, I would also be very interested in knowing how you are generating those images. The loss in "roundness" of the circles is not really something worth to mention since the laser cannot do them anywayLatinist
The images included in the question are copy-pasted matplotlib plots. To get the true 5028 DPI image you need to run the code. @KJLatinist
a laser engraver will happily engrave vector paths. vectors are the proper input format to such a device. nobody cares about PDF here. that's just a means to an end.Mo

© 2022 - 2024 — McMap. All rights reserved.