Is it possible to do a "zoom inset" using seaborn?
Asked Answered
Y

1

5

This example from matplotlib shows how to do an inset. However I am working with seaborn, specifically the kdeplot.

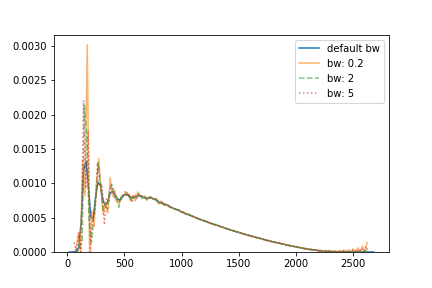
sns.kdeplot(y, label='default bw')
sns.kdeplot(y, bw=0.5, label="bw: 0.2", alpha=0.6)
sns.kdeplot(y, linestyle="--", bw=2, label="bw: 2", alpha=0.6)
sns.kdeplot(y, linestyle=":", bw=5, label="bw: 5", alpha=0.6)

It so happens that I have a lot of empty space on the right side of the graph and I would like to put a zoomed in inset there to clarify the lower x range. (If need be I could move the legend out as well, but that's besides the point)

enter image description here

Is it possible to do that with seaborn alone or do I have to forego the convenience of seaborn and convert the plots to matplotlib?

Yuille answered 4/9, 2018 at 7:10 Comment(2)
Yes, you can do exactly what is shown in the link you have posted which does of course use matplotlib but can interact with the plots made in seabornSaar
There is also a "zoomed_inset" capability with matplotlib that you can also use with seaborn. Example with matplotlib - matplotlib.org/examples/axes_grid/inset_locator_demo2.htmlSaar
I
13

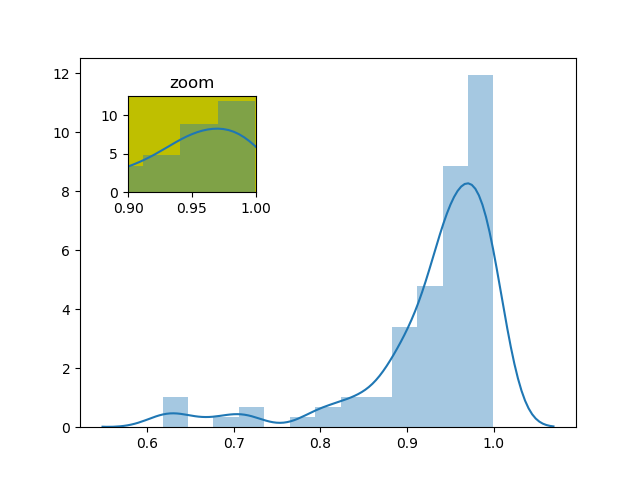
seaborn is just a wrapper around matplotlib, you do not have to chose one or the other. In your case, you can instruct sns.distplot() to use whathever Axes object you want using the ax= parameter

Therefore:

fig, ax = plt.subplots()
sns.distplot(d, ax=ax)

ax2 = plt.axes([0.2, 0.6, .2, .2], facecolor='y')
sns.distplot(d, ax=ax2)
ax2.set_title('zoom')
ax2.set_xlim([0.9,1.])

enter image description here

Irrelevant answered 4/9, 2018 at 8:17 Comment(1)
Could you clarify what plt is? I assume that's matplotlib.pyplot?Quan

© 2022 - 2024 — McMap. All rights reserved.