Recharts Y-Axis interval issue
Asked Answered
D

1

5

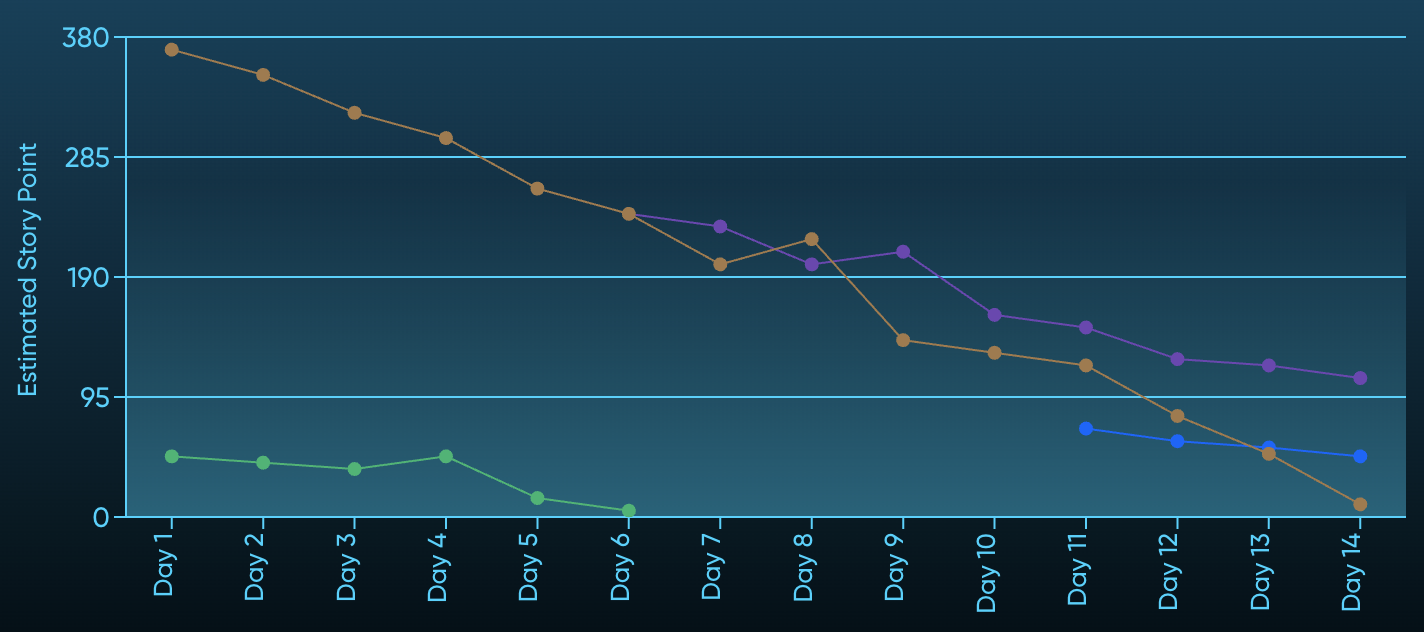
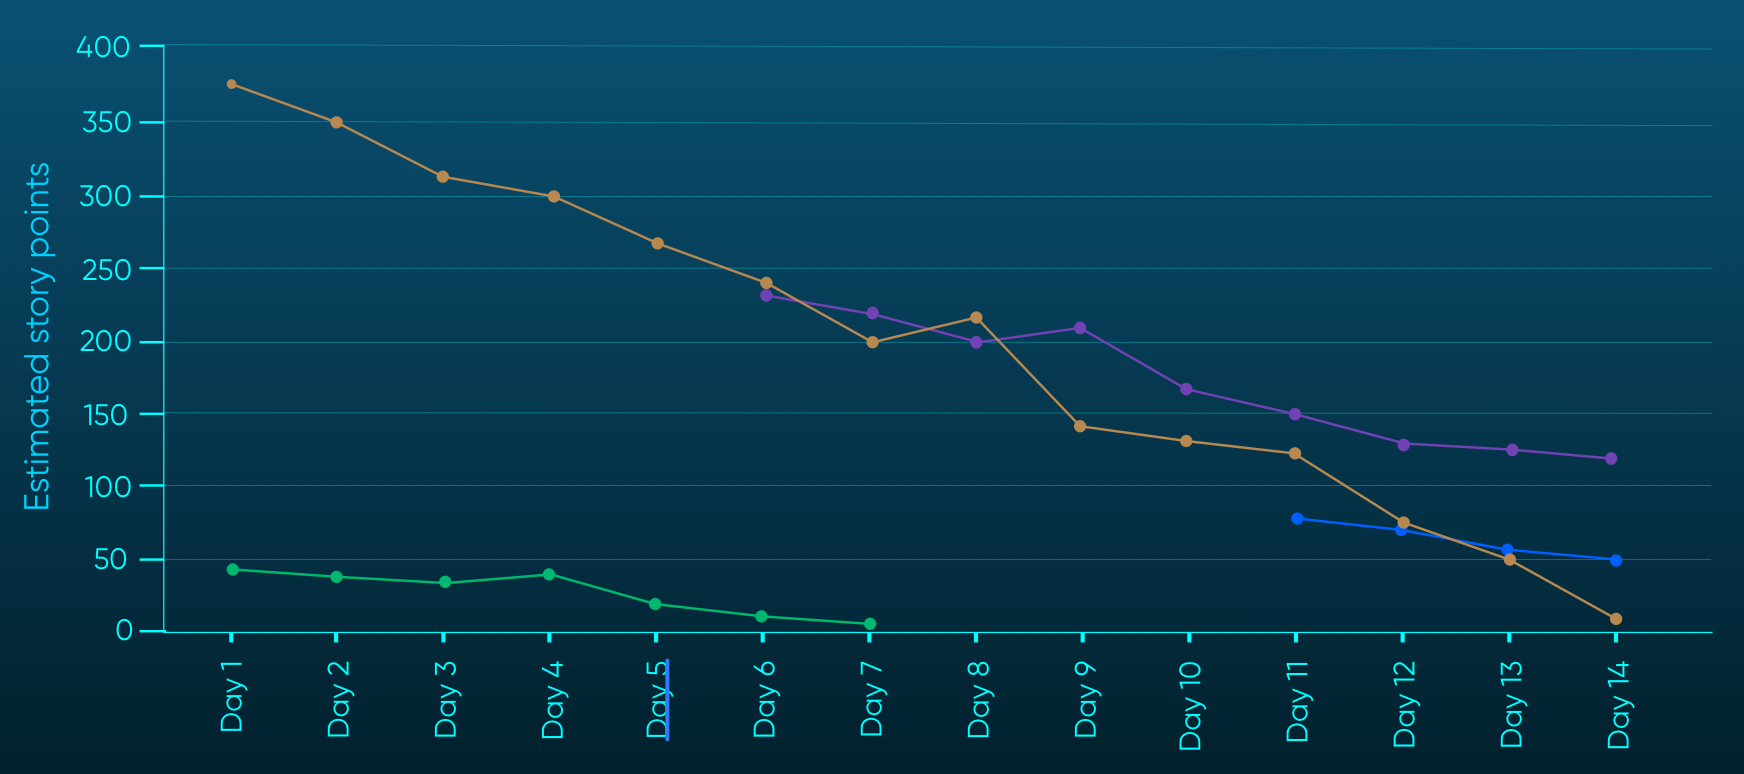
I am using Recharts Library for the graph in the ReactJS. There is one strange issue of setting intervals for the Y-Axis. There are few options available "preserveStart" | "preserveEnd" | "preserveStartEnd" | Number. For me, this is not working.

I have attached a couple of screens to showcase what I am expecting and what I get.

Expectation Expectation

Actual Actual

Note: Due to the confidentiality of the project, I am not allowed to put the code here. Please let me know if more information is required.

Dogmatist answered 24/8, 2020 at 5:10 Comment(0)
T
13

In order to see a given number of ticks on the Y-Axis, you need to use the props tickCount - the number of ticks to show (by default, it's 5).

So you're Y-Axis should simply look like this:

<YAxis tickCount={10} />

The interval props allows you to show only a part of the ticks; '0' would show all, '1' would show half (1 every 2 ticks), etc.

Toughie answered 15/9, 2020 at 12:44 Comment(0)

© 2022 - 2024 — McMap. All rights reserved.