I've been creating packages for Oracle db using PL/SQL and i'm trying to find a good way to debug a PL/SQL package without using the "put_line" command, does anyone have some good tips on how to successfully debug a PL/SQL package either on Toad or SQLPlus?
Depending on the version of TOAD, the icons and toolbars will look different, but the process is the same:
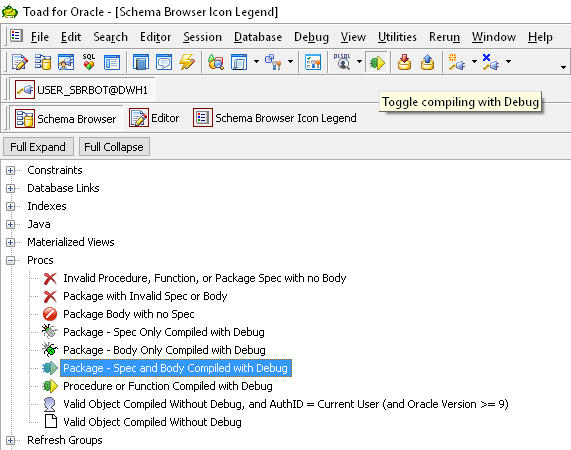
- Make sure the "Toggle compiling with Debug" option is turned on
- Click "Compile" button
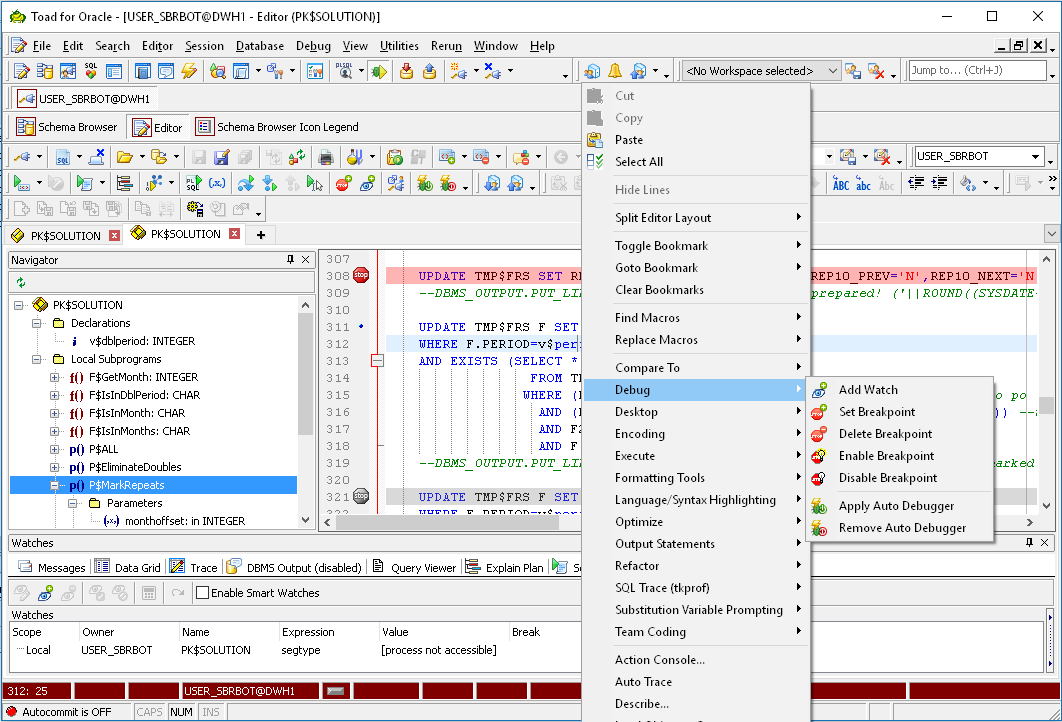
- a. Set a breakpoint
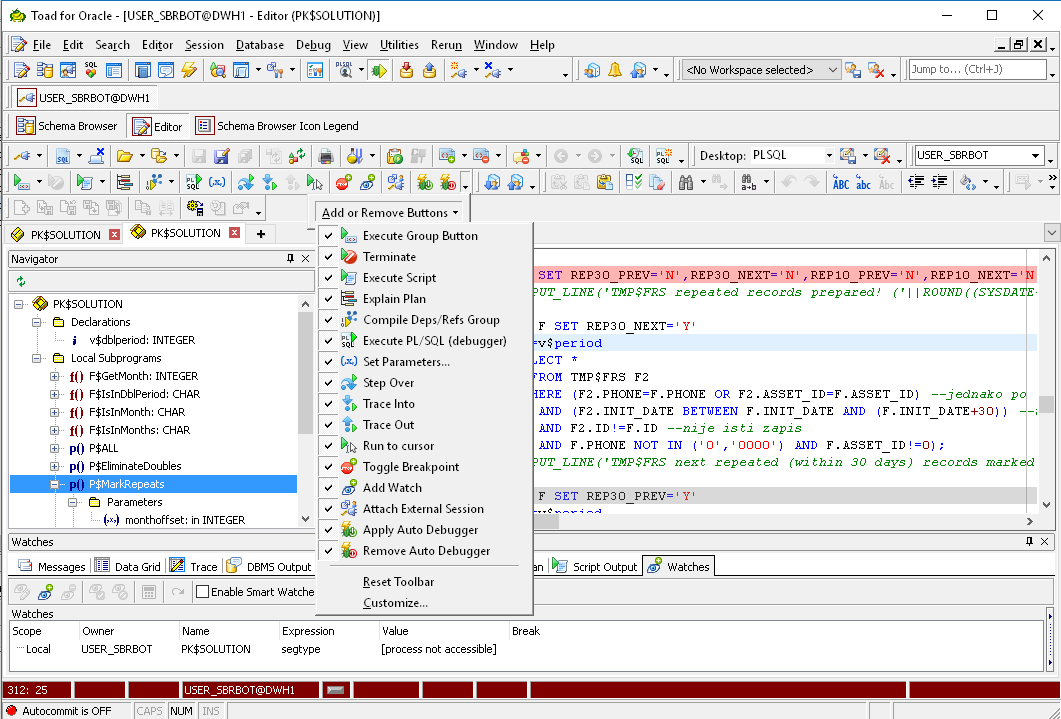
- Click "Execute PLSQL with debugger"
Toad 9.7:

Toad 11.6:

First of all, in order to be able to debug PL/SQL code, one must have appropriate database privilege for debugging. (GRANT DEBUG CONNECT SESSION TO user). If you're not granted this privilege, you DB tool (like Quest TOAD) might not even show debugging options or might show it disabled.
Second, prior to debugging, the code (procedure, function or package) it has to be precompiled for debugging. When one compiles the code with debug option, then compiler inserts additional data into compiled code to be able to stop on breakpoints during process of debugging. (Switch on debug option with Toggle compile with Debug and compile your code) After you finish your development phase with debugging, you should recompile your code without debugging option (Switch off Toggle compile with Debug and compile your code).
Then you should insert debugging breakpoints into your code and watches (variables) you want to track in debugger during execution.
Finally you should start your code with debug, the execution will stop on first breakpoint and using debugg toolbar you can step into, step over, run to cursor ... in your code.
To enable DEBUGING, Grant below privileges' and re-open TOAD. It always works for me.
    GRANT ALTER SESSION TO <databaseUser>;
    GRANT CREATE SESSION TO <databaseUser>;
    GRANT EXECUTE ON DBMS_DEBUG to <databaseUser>;
    GRANT ALTER ANY PROCEDURE TO <databaseUser>;
    GRANT CREATE ANY PROCEDURE TO <databaseUser>;
    GRANT DEBUG ANY PROCEDURE TO <databaseUser>;
    GRANT DEBUG CONNECT SESSION TO <databaseUser>;
© 2022 - 2024 — McMap. All rights reserved.


