the issue is the noise and the faint signal. you can subdue the noise with averaging/integration, while maintaining the signal because it's replicated along a dimension (signal is a line).
your approach using a very wide but narrow kernel can be extended to simply integrating along the whole image.
- rotate the image so the suspected line is aligned with an axis (let's say horizontal)
- sum up all pixels of one scanline (horizontal line),
np.sum(axis=1) or mean, either way mind the data type. working with floats is convenient.
- work with the 1-dimensional series of values.
this will not tell you how long the line is, only that it's there and potentially spanning the whole width.
edit: since my answer got a reaction, I'll elaborate as well:
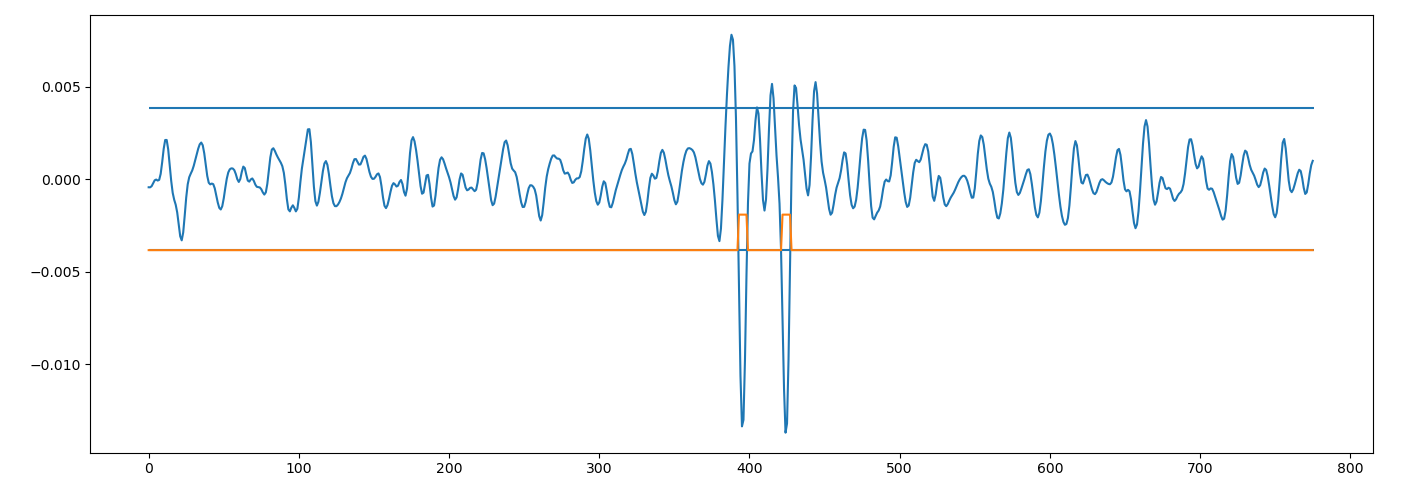
I think you can lowpass that to get the "gray" baseline, then subtract ("difference of gaussians"). that should give you a nice signal.
import numpy as np
import cv2 as cv
import matplotlib.pyplot as plt
import scipy.ndimage

im = cv.imread("0gczo.png", cv.IMREAD_GRAYSCALE) / np.float32(255)
relief = im.mean(axis=1)
smoothed = scipy.ndimage.gaussian_filter(relief, sigma=2.0)
baseline = scipy.ndimage.gaussian_filter(relief, sigma=10.0)
difference = smoothed - baseline
std = np.std(difference)
level = 2
outliers = (difference <= std * -level)
plt.plot(difference)
plt.hlines([std * +level, std * -level], xmin=0, xmax=len(relief))
plt.plot(std * -level + outliers * std)
plt.show()
# where those peaks are:
edgemap = np.diff(outliers.astype(np.int8))
(edges,) = edgemap.nonzero()
print(edges)           # [392 398 421 427]
print(edgemap[edges])  # [ 1 -1  1 -1]
![the plot]()


