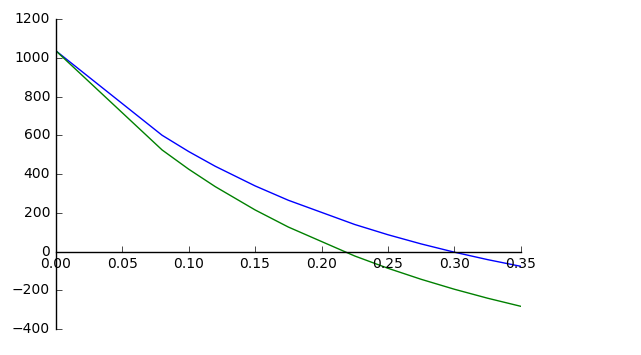
How do you make the x-axis pass through (0,0) with matplotlib in Python?
Asked Answered
A

2

5

How do I make the horizontal axis pass through the origin?

import numpy as np
import matplotlib.pyplot as plt

rateList=[0,0.08,.1,.12,.15,.175,.225,.25,.275,.3,.325,.35]

list1=[-316.8,-424,-2.8,622,658,400,83,16.8,0]
NPV_Profile1=[np.npv(x,list1) for x in rateList]

list2=[-496,-760,84,1050.4,658,400,83,16.8,0]
NPV_Profile2=[np.npv(x,list2) for x in rateList]

plt.plot(rateList,NPV_Profile1,rateList,NPV_Profile2)

plt.show()
Amberlyamberoid answered 17/5, 2017 at 5:30 Comment(0)
B
15

Try with:

import numpy as np
import matplotlib.pyplot as plt

rateList=[0,0.08,.1,.12,.15,.175,.225,.25,.275,.3,.325,.35]

list1=[-316.8,-424,-2.8,622,658,400,83,16.8,0]

NPV_Profile1=[np.npv(x,list1) for x in rateList]

list2=[-496,-760,84,1050.4,658,400,83,16.8,0]

NPV_Profile2=[np.npv(x,list2) for x in rateList]

fig, ax = plt.subplots()
ax.plot(rateList,NPV_Profile1,rateList,NPV_Profile2)


# set the x-spine
ax.spines['left'].set_position('zero')

# turn off the right spine/ticks
ax.spines['right'].set_color('none')
ax.yaxis.tick_left()

# set the y-spine
ax.spines['bottom'].set_position('zero')

# turn off the top spine/ticks
ax.spines['top'].set_color('none')
ax.xaxis.tick_bottom()

plt.show()

The output:

enter image description here

Begrudge answered 17/5, 2017 at 5:59 Comment(0)
C
0

My answer illustrates a frequent motivation to move only the x-axis: stacked diagrams with different horizontal axes but hspace=0.

import numpy as np
from matplotlib.pyplot import subplots

t = np.linspace(0, 3*np.pi)
U = np.sin(t)
x = np.linspace(-4, 4)
y = 1/(1 + x**2)

fig, (ax1, ax2) = subplots(2, 1, figsize=(8, 5), gridspec_kw={'hspace': 0})
ax1.plot(t, U)
ax1.spines['bottom'].set_position(('data', 0)) #'zero')
ax2.plot(x, y)
ax2.set_ylim(0)
fig.tight_layout()
fig.show()

The result

Collodion answered 21/10 at 22:18 Comment(0)

© 2022 - 2024 — McMap. All rights reserved.