How to plot square function with matplotlib
Asked Answered
S

2

5

I have an list of values that alternate between 0 and 1, eg [0,1,0,1,0] and I want to graph them so they appear as a square wave using matplotlib for python. I have this so far:

input_amp = [1,0,1,0,1,0,1,0,1,0]
plt.plot(input_amp, marker='d', color='blue')
plt.title("Waveform")
plt.ylabel('Amplitude')
plt.xlabel("Time")
plt.savefig("waveform.png")
plt.show()

This gives me an output like this this:

How do I make it so instead of going on an angle between the points the line stays flat?

I found this post but it deals more with an animation and not just plotting the function.

Sweettempered answered 23/2, 2016 at 13:55 Comment(0)
L
17

The relevant bit from that post you reference is the drawstyle:

 plt.plot(input_amp, marker='d', color='blue', drawstyle='steps-pre')
Lavernelaverock answered 23/2, 2016 at 14:1 Comment(1)
drawstyle='steps-post' is more commonly used.Homogeny
O
-1

"Elementary, Watson!"

import matplotlib.pyplot as plot
import numpy as np

# Sampling rate 1000 hz / second
t = np.linspace(0, 1, 100, endpoint=True)

# Plot the square wave signal
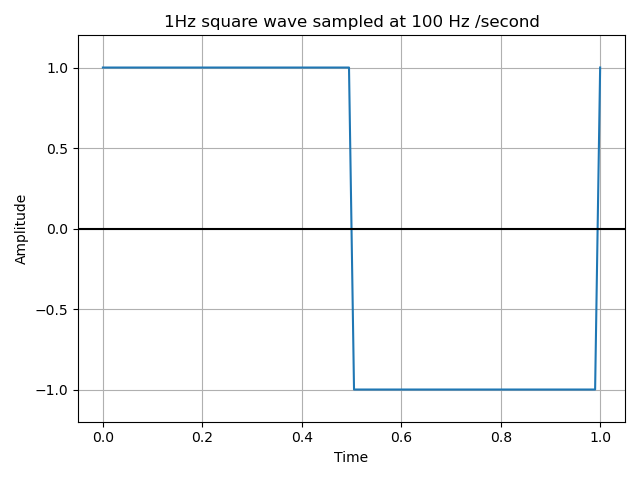
plot.plot(t, signal.square(2 * np.pi * 1 * t))

# A title for the square wave plot
plot.title('1Hz square wave sampled at 100 Hz /second')

# x axis label for the square wave plot
plot.xlabel('Time')
    
# y axis label for the square wave plot
plot.ylabel('Amplitude')
plot.grid(True, which='both')

# Provide x axis and line color
plot.axhline(y=0, color='k')

# Set the max and min values for y axis
plot.ylim(-1.2, 1.2)

# Display the square wave
plot.show()

square wave

Ophelia answered 5/2, 2021 at 23:32 Comment(1)
The amplitude of this waveform is from 1 to -1. Can you please show how can extend this wave from 0 to 2 instead?Philoprogenitive

© 2022 - 2024 — McMap. All rights reserved.