How do I do an F-test to compare nested linear models in Python?
Asked Answered
P

2

5

I want to compare two nested linear models, call them m01, and m02 where m01 is the reduced model and m02 is the full model. I want to do a simple F-test to see if the full model adds significant utility over the reduced model.

This is very simple in R. For example:

mtcars <- read.csv("https://raw.githubusercontent.com/focods/WonderfulML/master/data/mtcars.csv")
m01 <- lm(mpg ~ am + wt, mtcars)
m02 <- lm(mpg ~ am + am:wt, mtcars)
anova(m01, m02)

Gives me the following output:

enter image description here

Which tells me that adding the am: wt interaction term significantly improves the model. Is there a way to do something similar to this in Python/sklearn/statsmodels?

Edit: I looked at this question before posting this one and can not figure out how they are the same. The other question is doing an F-test on two vectors. This question is about comparing 2 nested linear models.

I think this is what I need:

http://scikit-learn.org/stable/modules/generated/sklearn.feature_selection.f_regression.html#sklearn.feature_selection.f_regression

but am not sure what exactly to pass this function. If anyone could provide or point to an example, that would be extremely helpful.

Platitude answered 21/7, 2017 at 17:48 Comment(6)
You can try sklearn.model_selection scikit-learn.org/stable/modules/… from sklearn.feature_selection import f_regressionTrawler
the duplicate mark is incorrect. As mentioned in the edit, these are two different f-tests.Beason
for the answer, see statsmodels anova_lm statsmodels.org/dev/anova.html to compare nested models, OLS results also has three compare_xxx_test methods for direct testing of a nested restricted against the unrestricted model. statsmodels.org/dev/generated/…Beason
@user333700 Thanks. Just need to get familiar with this style of formula syntax. Looks similar to what R uses on the surface.Platitude
@Trawler Thanks. I looked at that link and haven't ruled it out yet, but I just want to compare sets of 2 nested models at a time like I show in my example. The model_selection is doing way more than I need.Platitude
f_regression is the function u wantTrawler
P
11

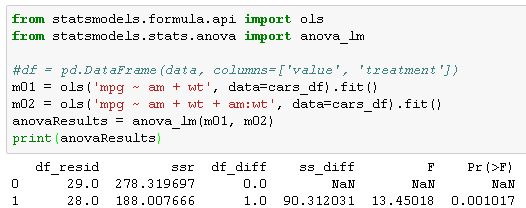
Adapting Jeremy's answer in the following way allowed me to get the same result I obtained in R:

import pandas as pd
from statsmodels.formula.api import ols
from statsmodels.stats.anova import anova_lm

cars_df = pd.read_csv("https://raw.githubusercontent.com/focods/WonderfulML/master/data/mtcars.csv")
m01 = ols('mpg ~ am + wt', data=cars_df).fit()
m02 = ols('mpg ~ am + wt + am:wt', data=cars_df).fit()
anovaResults = anova_lm(m01, m02)
print(anovaResults)

This gave me the following results in my jupyter notebook:

enter image description here

I also got these rather cryptic errors:

enter image description here

Anyone have a clue as to what is generating these errors?

Platitude answered 21/11, 2017 at 4:37 Comment(1)
This would be better as a new question. brief answer: you can ignore those warnings. The F-value is and is supposed to be nan, but recently numpy and scipy have started to issue warnings for nans in the distributions.Beason
S
5

I found this book helpful ("An introduction to statistics with python" / Thomas Haslwanter)

Here is the relevant code sample:

import pandas as pd
from statsmodels.formula.api import ols
from statsmodels.stats.anova import anova_lm

df = pd.DataFrame(data, columns=['value', 'treatment'])
model = ols('value ~ C(treatment)', data=df).fit()
anovaResults = anova_lm(model)
print(anovaResults)

Look at the book link above for the print result.

Note: anova_lm sometimes used with the parameter 'typ', try its different possible values to see which suitable for you.

Shortchange answered 17/11, 2017 at 4:59 Comment(1)
+1 for the reference. This was a different kind of ANOVA, but I was able to make some small adjustments to this example to get the same results.Platitude

© 2022 - 2024 — McMap. All rights reserved.