Debugging in Safari's Web Inspector, when using a module loader like SystemJS
Asked Answered
C

2

116

I'm creating an Ionic app using es6 modules, TypeScript and SystemJS as a module loader. This is my setup:

tsconfig.json:

{
  "compilerOptions": {
    ...
    "target": "es5",
    "module": "system",
    ...
  }
}

index.html:

<script src="lib/system.js"></script>
<script src="systemjs.config.js"></script>
<script>System.import('js/app.js')</script>

example script (TypeScript):

import {IConfig} from "./app-config";

export class ConfigLoader {
    ...
}

Everything runs great in Chrome. However, when debugging using Safari's Web Inspector, I cannot place any breakpoints in the scripts because Web Inspector only shows scripts that are loaded directly from the HTML (through script tags), and not scripts loaded by XHR (in my case, by SystemJS). This means I cannot debug my own scripts, which is of course unacceptable.

I tried to work around this by using SystemJS like before, but also placing the script tags in the html, like so:

<script src="lib/system.js"></script>
<script src="systemjs.config.js"></script>
<script src="js/app-config.js"></script>
 ... other app scripts
<script>System.import('js/app.js')</script>

However, this doesn't work, as SystemJS does not seem happy about this:

Invalid System.register call. Anonymous System.register calls can only be made by modules loaded by SystemJS.import and not via script tags.

How do I use SystemJS and at the same time have the ability to debug in Safari? I'm looking for a solution a little more sophisticated than 'put a debugger statement in each script'...

Concordia answered 11/1, 2017 at 15:4 Comment(17)
This may seem like a weird advice, and since the question has been open since the 11th of January, but I would advice you to maybe dive into webpack. I have been reading into SystemJS, but I am not getting the feeling it will cover your needs.Safko
Looks like if you can't get the script loaded in the html like you were doing you're out of luck. Chrome seems to be the only browser that supports this as you've seen.Fates
Possible duplicate of Setting breakpoints dynamically at runtime in JavascriptNightdress
@TheMuffinMan IE11, Edge, Opera, and Firefox also support debugging dynamic scripts. Since you will ultimately create a bundle for production, consider debugging the bundled code in Safari.Phillis
Possible duplicate of How to debug dynamically loaded JavaScript (with jQuery) in the browser's debugger itself?Peursem
Why are you limited to debugging in Safari ?Photodrama
@Photodrama because sometimes bugs occur only in specific browsersConcordia
not sure if Safari's 3% is worth your effort but maybe it is for your customers. netmarketshare.com/browser-market-share. You could try a trial of BrowserStack: browserstack.com/live/features browserstack.com/developer-tools It seems like it could be worth a shot if it is still something you are working on.Photodrama
use debugger JS keywordManiacal
@KamilKiełczewski The question explicitly states 'I'm looking for a solution a little more sophisticated than 'put a debugger statement in each script'...'Concordia
you have som problem with debugger statement?Maniacal
As debugger; cannot help you, then other console magic won't do either, dead end. So I think you need to change SystemJS to some static bundler, like webpack or gulp. This will bring lots work, but as the comments show SystemJS really doest fit your caseUnconquerable
What's wrong with debugger? That is literally adding a breakpoint programmatically 🤔Congressional
@ChristosLytras In my case, I was debugging a bug occurring in a hybrid app (cordova) deployed on an iOS device (and only on that device). At the time the question was asked, using a debugger statement meant re-deploying the app (with the debugger statements) and then do another deploy to remove those statements again, once the bug was found. This was very time consuming. Also, debugger statements cannot be used for bugs occurring in production that cannot be reproduced in development.Concordia
you can select break points in the source tab in Safari. You just need to activate the developer mode. Preferenses -> advanced -> Show Developer menu in menu bar.Torry
@Concordia two questions: a) is the SystemJS config inclusion correct ? That is, shouldn't config type be something else under <script> tag ? b) also, wondering, if the safari webview supports Promises. Why ? I think System.import might require that.Duff
@tyskr the question is more than 3 years old, I cannot verify this for you as I don't have access to the codeConcordia
A
1

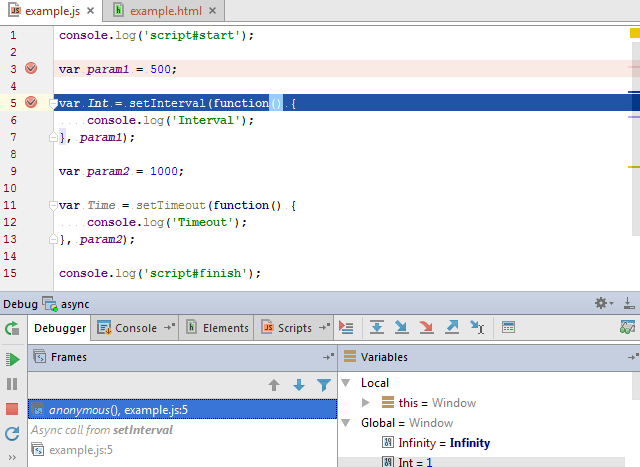
Well, maybe you can use some IDE like WebStorm with a strong Debugger for Web and Node.

Examples:

enter image description here enter image description here enter image description here

You can see more about WebStorm debugger here.

Some alternatives for WebStorm:

  1. Atom (Free)
  2. Intellij IDEA (community: Free)
  3. Visual Studio Code (Free)
  4. ...

P.S: I develop Ionic and React apps with WebStorm :D

Adlare answered 6/2, 2020 at 14:43 Comment(1)
I've been trying to get into Webstorm, but I have so many useful features provided by the extension system in VS Code that Webstorm doesn't have, it is hard to make the jump.Porcine
U
0

Have you looked into using a remote debugger, such as https://github.com/google/ios-webkit-debug-proxy.

Also there is ghostlab, here is a nice article on getting started https://css-tricks.com/using-chrome-devtools-to-debug-javascript-in-any-browser-with-ghostlab-2/

Undeviating answered 24/7, 2020 at 6:35 Comment(0)

© 2022 - 2024 — McMap. All rights reserved.