Determining and storing Voronoi Cell Adjacency
Asked Answered
I

4

5

I will be working with a set of thousands of points. I can implement or use existing implementations of Fortunes Algorithm to produce the Voronoi diagram of the points, but my application also requires me to know adjacency with respect to each Voronoi Cell.

More specifically, for any Voronoi cell I need to know the cells that are adjacent to this. At this point I'm not to concerned with output or storage method as I can likely massage an implementation to work in my favor.

Is anyone aware of an algorithm, or better yet aware of an implemented algorithm that can accomplish cell adjacency determination? The work I will be doing is in python, but anything would be great as I can easily translate the code.

Thanks!

Inconsecutive answered 11/3, 2012 at 2:35 Comment(0)
G
12

Although this is an old question, I was searching for same and thought that the answer might still be helpful for somebody. One can use Delaunay from scipy module.

from scipy.spatial import Delaunay
from collections import defaultdict
import itertools

points=[[0.0, 0.0], [0.0, 1.0], [0.2, 0.5], [0.3, 0.6], [0.4, 0.5], [0.6, 0.3], [0.6, 0.5], [1.0, 0.0], [1.0, 1.0]]
tri = Delaunay(points)
neiList=defaultdict(set)
for p in tri.vertices:
    for i,j in itertools.combinations(p,2):
        neiList[i].add(j)
        neiList[j].add(i)

for key in sorted(neiList.iterkeys()):
    print("%d:%s" % (key,','.join([str(i) for i in neiList[key]])))

0:1,2,5,7
1:0,8,2,3
2:0,1,3,4,5
3:8,1,2,4,6
4:2,3,5,6
5:0,2,4,6,7
6:8,3,4,5,7
7:8,0,5,6
8:1,3,6,7
   
# This is for visualization
from scipy.spatial import Voronoi, voronoi_plot_2d
import matplotlib.pyplot as plt
vor = Voronoi(points)
voronoi_plot_2d(vor)
for i,p in enumerate(x):
    plt.text(p[0], p[1], '#%d' % i, ha='center')
plt.show()

enter image description here

Gunmaker answered 28/5, 2013 at 12:51 Comment(3)
Useful. Worth highlighting though that this visualisation of the voronoi diagram can be misleading at the boundaries. E.g. node #0 is adjacent to #1 and #7 but the plot doesn't show this.Parsec
Thanks for the answer. Why did you use defaultdict? How is that different from regular {} ?Eaglewood
Below I posted a simpler (and more efficient) answer based on this post.Panathenaea
A
3

You could do this in a few different ways.

If you just have access to the Voronoi diagram, you could look for shared edge segments between cells. If you find two cells that share a Voronoi edge segment it means that they are adjacent. An efficient way to build up the adjacency information for the whole data-set is to build a hash table of edges by scanning the list of Voronoi cells.

for (all cells in voronoi diagram)
    for (all edges in current cell)
        if (matching edge found in hash table)
            // the current cell is adjacent to the cell that added
            // the matching edge segment to the hash table
        else
            // push current edge segment onto hash table and mark with 
            // current cell index
        endif
    endfor
endfor

There are many good existing packages that can be used to calculate the Voronoi diagram/Delaunay triangulation for a point-set. Since it's a computationally expensive and numerically sensitive operation I'd recommend sticking with an existing library. The Triangle and QHull packages are widely used.

Hope this helps.

Agnella answered 11/3, 2012 at 9:42 Comment(0)
P
2

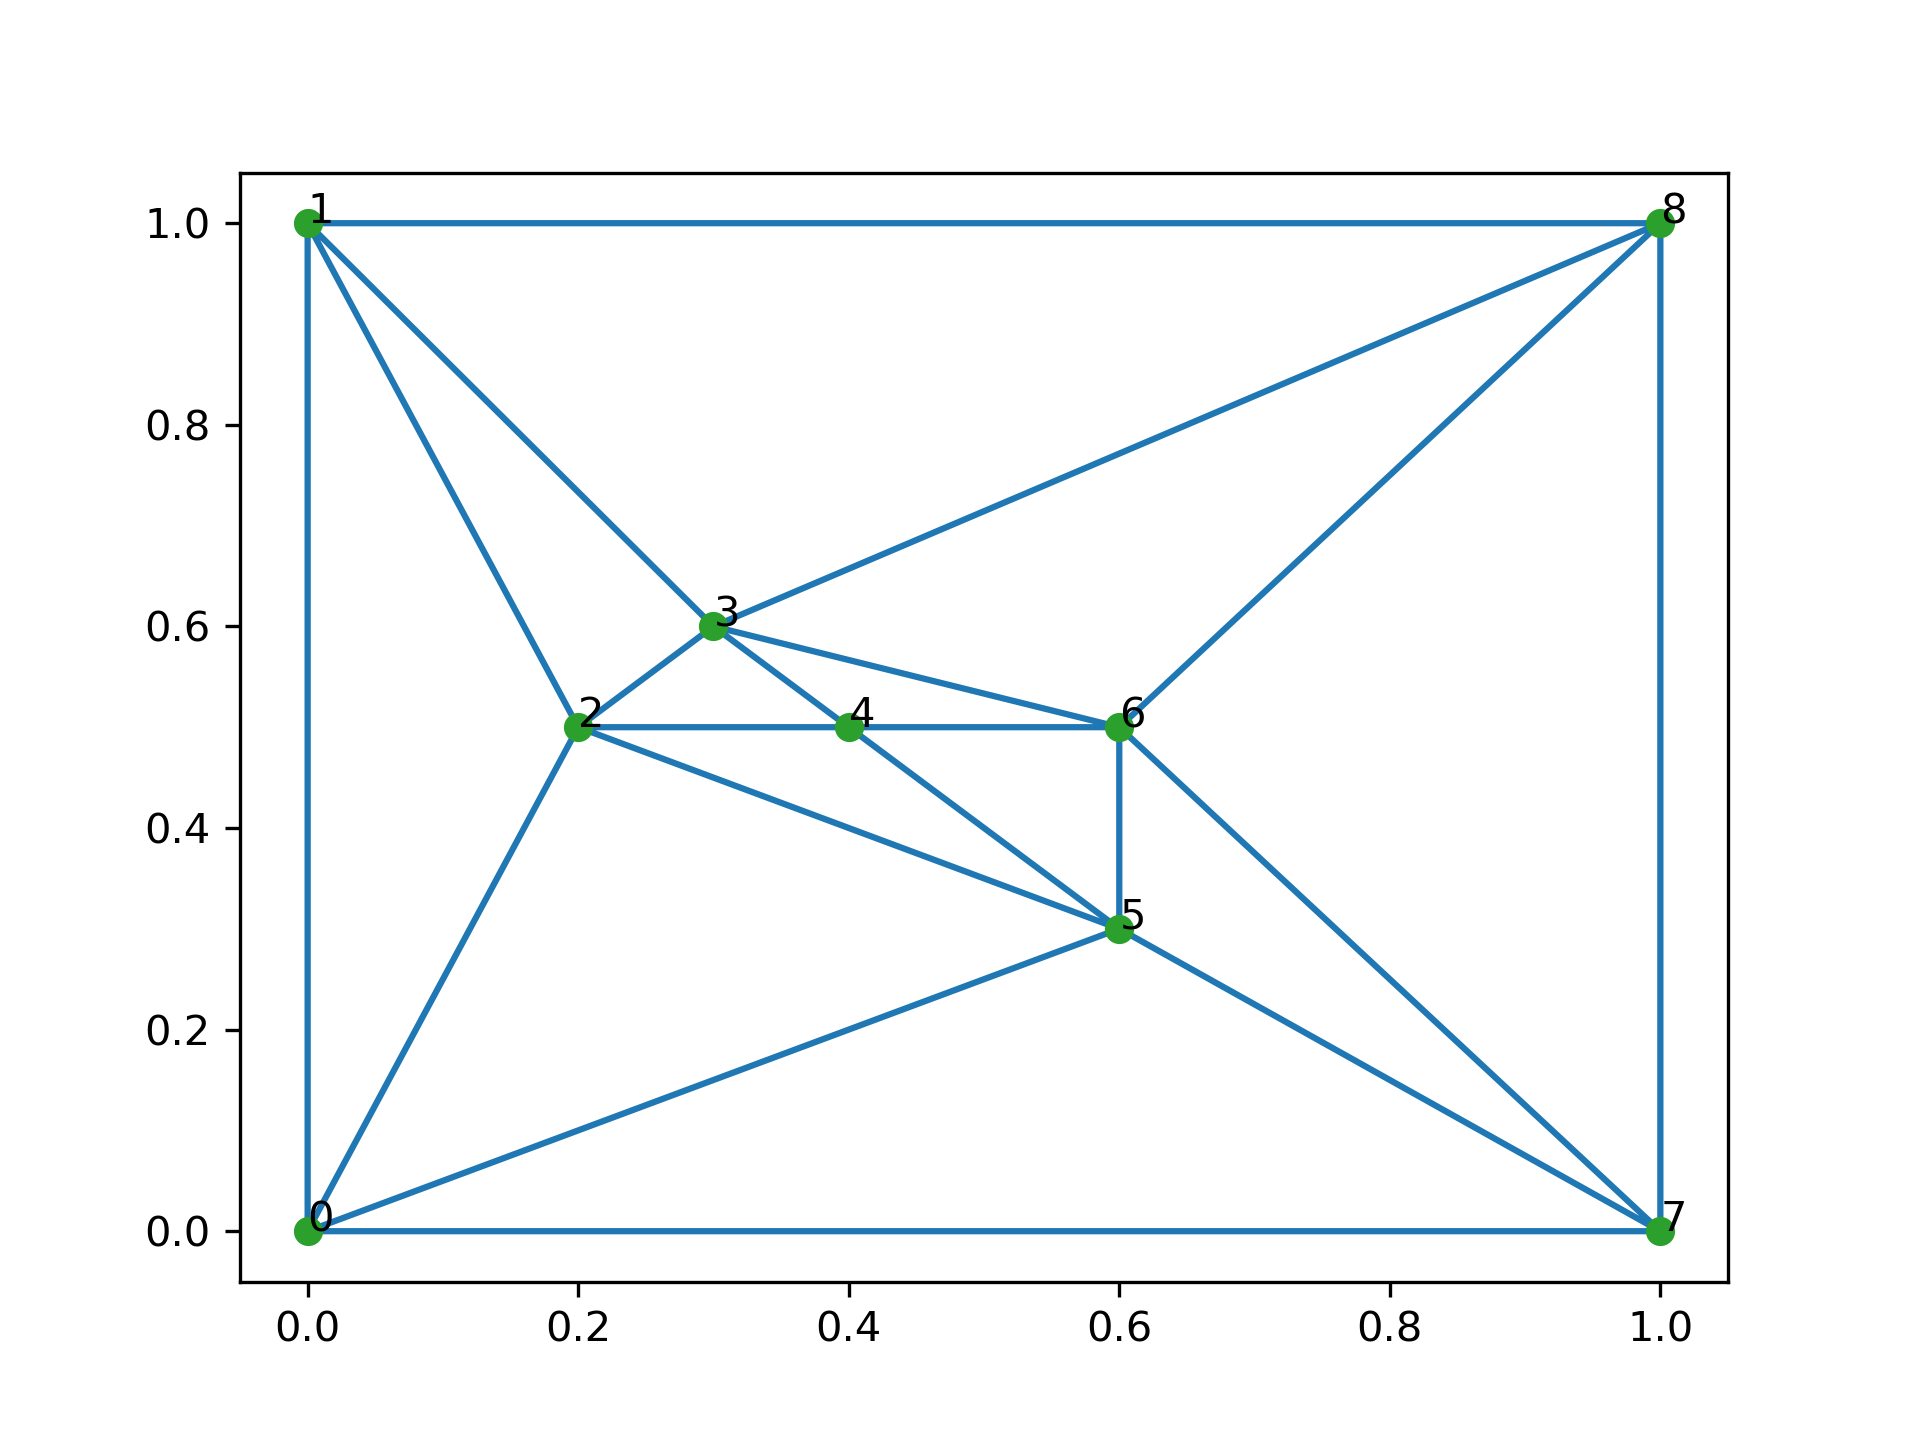
I rewrote @imsc answer in a more simple way and without using the itertools and defaultdict libraries, in case it may be helpful to someone:

import numpy as np
import matplotlib.pyplot as plt
from scipy.spatial import Delaunay

points=np.array([[0.0, 0.0], [0.0, 1.0], [0.2, 0.5], [0.3, 0.6], [0.4, 0.5], [0.6, 0.3], [0.6, 0.5], [1.0, 0.0], [1.0, 1.0]])

indptr_neigh, neighbours = Delaunay(points).vertex_neighbor_vertices

#Accessing the neighbours
for i in range(len(points)):
    i_neigh = neighbours[indptr_neigh[i]:indptr_neigh[i+1]]
    print('i: %d, i_neigh:'  %i, i_neigh)

#Plot
plt.triplot(points[:,0], points[:,1], Delaunay(points).simplices)
plt.plot(points[:,0], points[:,1], 'o')
for i in range(len(points)):
    plt.text(points[i,0], points[i,1], str(i))
plt.savefig('delaunay.png', dpi = 300)

Output:

i: 0, i_neigh: [2 1 7 5]
i: 1, i_neigh: [2 0 3 8]
i: 2, i_neigh: [1 0 3 4 5]
i: 3, i_neigh: [8 1 2 4 6]
i: 4, i_neigh: [3 2 6 5]
i: 5, i_neigh: [7 0 6 4 2]
i: 6, i_neigh: [8 7 3 4 5]
i: 7, i_neigh: [8 6 5 0]
i: 8, i_neigh: [3 1 6 7]

enter image description here

In my computer this is a bit faster than @imsc answer.

Panathenaea answered 9/9, 2022 at 14:15 Comment(0)
O
1

A possible algorithm is available here which uses a Linear Programming approach.

PuLP can generate MPS or LP files and call GLPK, COIN, CPLEX, and GUROBI to solve linear problems.

PuLP is an LP modeler written in Python and could be used to model this linear program in Python and then solve using GLPK.

Otic answered 11/3, 2012 at 8:0 Comment(0)

© 2022 - 2024 — McMap. All rights reserved.