Plot 2 tmap objects side-by-side
Asked Answered
D

3

5

Example:

I want to plot two tmap plots side by side, which are generated by this code.

library(tmap)
library(gridExtra)

data(World)

plot1=
  tm_shape(World, projection = "merc") + 
  tm_layout("", inner.margins=c(-1.72, -2.05, -0.75, -1.56)) +
  tm_borders(alpha = 0.3, lwd=2)

plot2=
  tm_shape(World, projection = "merc") + 
  tm_layout("", inner.margins=c(-1.72, -2.05, -0.75, -1.56)) +
  tm_borders(alpha = 0.3, lwd=2)

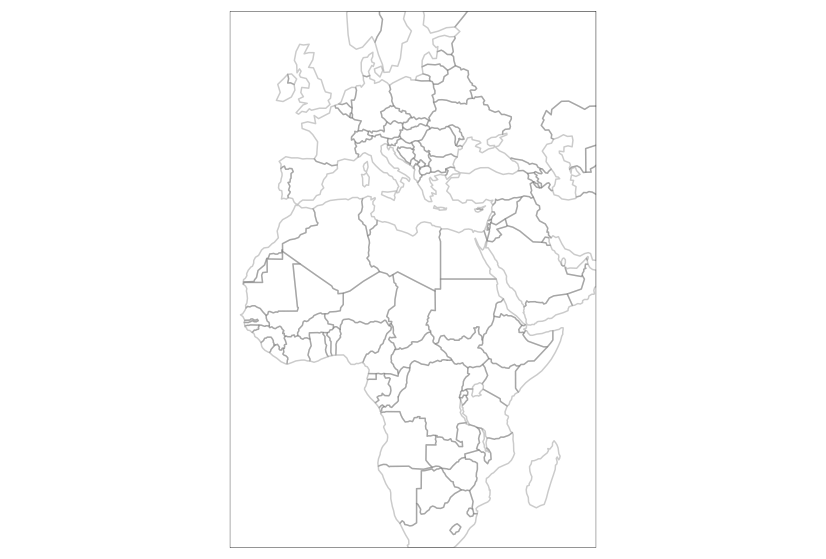
plot1 and plot2 work fine as single stand-alone plots: enter image description here
Problem:

I have problems to put both plots side-by-side. I tried:

grid.arrange(plot1, plot2) throughs an error Error in arrangeGrob(..., as.table = as.table, clip = clip, main = main, : input must be grob!. I thought that this should work (using gridExtra) as tmap seems to be based on the grid graphics system.

Also par(mfrow=c(1,2)) does not work as it shows only one plot (guess this is related as tmap plot does not follow the base graphics system).

Question:

How can I plot both objects plot1 and plot2 side-by-side (ncol=2)?

Update:

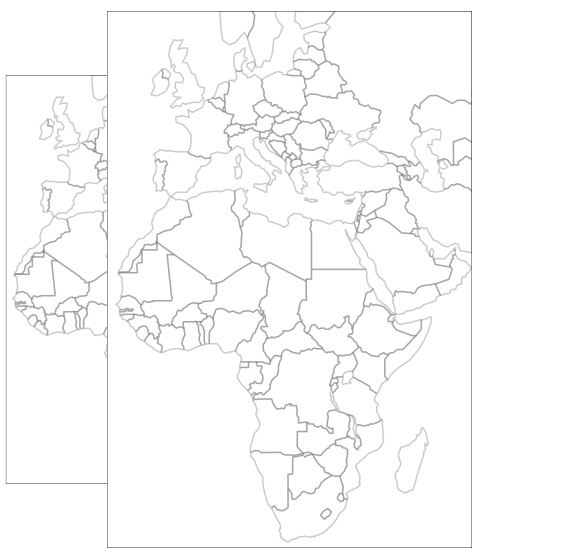
Regarding the proposed grid-based solution, I get overlapping plots instead of two column arranged plots.

enter image description here

> sessionInfo()
R version 3.1.2 (2014-10-31)
Platform: x86_64-apple-darwin13.4.0 (64-bit)

locale:
[1] de_DE.UTF-8/de_DE.UTF-8/de_DE.UTF-8/C/de_DE.UTF-8/de_DE.UTF-8

attached base packages:
[1] stats     graphics  grDevices utils     datasets  methods   base     

other attached packages:
[1] tmap_1.0    dplyr_0.4.3 sp_1.1-1   

loaded via a namespace (and not attached):
 [1] assertthat_0.1     class_7.3-11       classInt_0.1-23    colorspace_1.2-6   DBI_0.3.1          digest_0.6.8       e1071_1.6-4        ggplot2_1.0.1     
 [9] grid_3.1.2         gridBase_0.4-7     gtable_0.1.2       lattice_0.20-29    magrittr_1.5       MASS_7.3-35        munsell_0.4.2      parallel_3.1.2    
[17] plyr_1.8.3         proto_0.3-10       R6_2.1.1           raster_2.3-40      RColorBrewer_1.1-2 Rcpp_0.12.2        reshape2_1.4.1     rgdal_0.8-16      
[25] rgeos_0.3-11       scales_0.3.0       stringi_1.0-1      stringr_1.0.0      tools_3.1.2 
Duwe answered 17/12, 2015 at 21:20 Comment(0)
C
7

Nice question!

grid.arrange doesn't support tmap plots (yet?) in the same way it supports ggplot2 plots.

There are two options:

1) Use small multiples by assigning two values to an aesthetic (see examples from tm_facets). Your plots don't use aesthetics, but you can trick this as follows:

tm_shape(World, projection = "merc") + 
  tm_fill(col=c("white", "white")) +
  tm_layout("", inner.margins=c(-1.72, -2.05, -0.75, -1.56)) +
  tm_borders(alpha = 0.3, lwd=2)

2) Use the grid package to define viewports:

library(grid)
grid.newpage()
pushViewport(viewport(layout=grid.layout(1,2)))
print(plot1, vp=viewport(layout.pos.col = 1))
print(plot2, vp=viewport(layout.pos.col = 2))

Another thing, rather than clipping the shape with negative inner margins, you could also use the bounding box arguments inside tm_shape:

tm_shape(World, projection = "merc", xlim=c(-2e6, 6.5e6), ylim=c(-4e6, 8.5e6)) + 
  tm_borders(alpha = 0.3, lwd=2)

It produces the same map, but it the code a little cleaner.

Calm answered 18/12, 2015 at 8:33 Comment(5)
Thx a lot, unfortunately still have 2 issues: a) the grid based solution plots to plots but they do overlap. b) the solution using multiples create two plot well aligned but in 1 column instead of 2.Duwe
Could you post an image of issue a? As for issue b, the number is rows and columns is automatically determined by the aspect ratio of the graphics device, and those of the shape(s). You can set this manually with +tm_facets(ncol=2)Calm
It's working for me. Could you share your sessionInfo()?Calm
Ah, just what I thought! tmap 1.2 has been released two weeks ago on CRAN, where this viewport bug has been fixed.Calm
Thx a lot, unfortunately the OS X Mavericks binaries on CRAN is still on v1.0.Duwe
L
12

tmap_arrange()

https://cran.r-project.org/web/packages/tmap/tmap.pdf

data(World)
w1 <- qtm(World, projection = "eck4", title="Eckert IV")
w2 <- qtm(World, projection = "merc", title="Mercator")
w3 <- qtm(World, projection = "wintri", title="Winkel-Tripel")
w4 <- qtm(World, projection = "robin", title="Robinsin")

current.mode <- tmap_mode("plot")
tmap_arrange(w1, w2, w3, w4)
tmap_mode(current.mode)
Leifleifer answered 26/6, 2018 at 3:29 Comment(0)
C
7

Nice question!

grid.arrange doesn't support tmap plots (yet?) in the same way it supports ggplot2 plots.

There are two options:

1) Use small multiples by assigning two values to an aesthetic (see examples from tm_facets). Your plots don't use aesthetics, but you can trick this as follows:

tm_shape(World, projection = "merc") + 
  tm_fill(col=c("white", "white")) +
  tm_layout("", inner.margins=c(-1.72, -2.05, -0.75, -1.56)) +
  tm_borders(alpha = 0.3, lwd=2)

2) Use the grid package to define viewports:

library(grid)
grid.newpage()
pushViewport(viewport(layout=grid.layout(1,2)))
print(plot1, vp=viewport(layout.pos.col = 1))
print(plot2, vp=viewport(layout.pos.col = 2))

Another thing, rather than clipping the shape with negative inner margins, you could also use the bounding box arguments inside tm_shape:

tm_shape(World, projection = "merc", xlim=c(-2e6, 6.5e6), ylim=c(-4e6, 8.5e6)) + 
  tm_borders(alpha = 0.3, lwd=2)

It produces the same map, but it the code a little cleaner.

Calm answered 18/12, 2015 at 8:33 Comment(5)
Thx a lot, unfortunately still have 2 issues: a) the grid based solution plots to plots but they do overlap. b) the solution using multiples create two plot well aligned but in 1 column instead of 2.Duwe
Could you post an image of issue a? As for issue b, the number is rows and columns is automatically determined by the aspect ratio of the graphics device, and those of the shape(s). You can set this manually with +tm_facets(ncol=2)Calm
It's working for me. Could you share your sessionInfo()?Calm
Ah, just what I thought! tmap 1.2 has been released two weeks ago on CRAN, where this viewport bug has been fixed.Calm
Thx a lot, unfortunately the OS X Mavericks binaries on CRAN is still on v1.0.Duwe
A
0

I was wondering if in the meantime it has become possible to plot the 5 maps in the following example side by side without switching to tm_facets(ncol=5).

data(NLD_prov, NLD_muni)

tmap_mode("plot")
tm_shape(NLD_muni) +
tm_fill(c("pop_0_14", "pop_15_24", "pop_25_44", "pop_45_64", "pop_65plus"),
        style="kmeans", 
        palette=list("Oranges", "Greens", "Blues", "Purples", "Greys"),
        title=c("Population 0 to 14", "Population 15 to 24", "Population 25 to 44",
                "Population 45 to 64", "Population 65 and older")) +
tm_shape(NLD_prov) +
tm_borders() +
tm_format_NLD(frame = TRUE, asp=0)
Anamariaanamnesis answered 9/4, 2018 at 12:55 Comment(0)

© 2022 - 2024 — McMap. All rights reserved.