Implementing Otsu binarization from scratch python
Asked Answered
O

3

5

It seems my implementation is incorrect and not sure what exactly I'm doing wrong:

Here is the histogram of my image: enter image description here
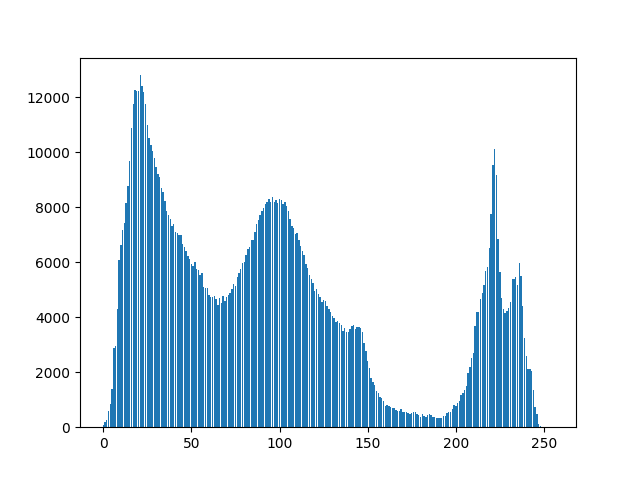
So the threshold should be around 170 ish? I'm getting the threshold as 130.

Here is my code:

#Otsu in Python

import numpy as np
from PIL import Image
import matplotlib.pyplot as plt  


def load_image(file_name):
    img = Image.open(file_name)
    img.load()
    bw = img.convert('L')
    bw_data = np.array(bw).astype('int32')
    BINS = np.array(range(0,257))
    counts, pixels =np.histogram(bw_data, BINS)
    pixels = pixels[:-1]
    plt.bar(pixels, counts, align='center')
    plt.savefig('histogram.png')
    plt.xlim(-1, 256)
    plt.show()

    total_counts = np.sum(counts)
    assert total_counts == bw_data.shape[0]*bw_data.shape[1]

    return BINS, counts, pixels, bw_data, total_counts

def within_class_variance():
    ''' Here we will implement the algorithm and find the lowest Within-  Class Variance:

        Refer to this page for more details http://www.labbookpages.co.uk
/software/imgProc/otsuThreshold.html'''

    for i in range(1,len(BINS), 1):         #from one to 257 = 256 iterations
       prob_1 =    np.sum(counts[:i])/total_counts
       prob_2 = np.sum(counts[i:])/total_counts
       assert (np.sum(prob_1 + prob_2)) == 1.0


       mean_1 = np.sum(counts[:i] * pixels[:i])/np.sum(counts[:i])
       mean_2 = np.sum(counts[i:] * pixels[i:] )/np.sum(counts[i:])
       var_1 = np.sum(((pixels[:i] - mean_1)**2 ) * counts[:i])/np.sum(counts[:i])
       var_2 = np.sum(((pixels[i:] - mean_2)**2 ) * counts[i:])/np.sum(counts[i:])


       if i == 1:
         cost = (prob_1 * var_1) + (prob_2 * var_2)
         keys = {'cost': cost, 'mean_1': mean_1, 'mean_2': mean_2, 'var_1': var_1, 'var_2': var_2, 'pixel': i-1}
         print('first_cost',cost)


       if (prob_1 * var_1) +(prob_2 * var_2) < cost:
         cost =(prob_1 * var_1) +(prob_2 * var_2)
         keys = {'cost': cost, 'mean_1': mean_1, 'mean_2': mean_2, 'var_1': var_1, 'var_2': var_2, 'pixel': i-1}  #pixels is i-1 because BINS is starting from one

    return keys


if __name__ == "__main__":

    file_name = 'fish.jpg'
    BINS, counts, pixels, bw_data, total_counts =load_image(file_name)
    keys =within_class_variance()
    print(keys['pixel'])
    otsu_img = np.copy(bw_data).astype('uint8')
    otsu_img[otsu_img > keys['pixel']]=1
    otsu_img[otsu_img < keys['pixel']]=0
    #print(otsu_img.dtype)
    plt.imshow(otsu_img)
    plt.savefig('otsu.png')
    plt.show()

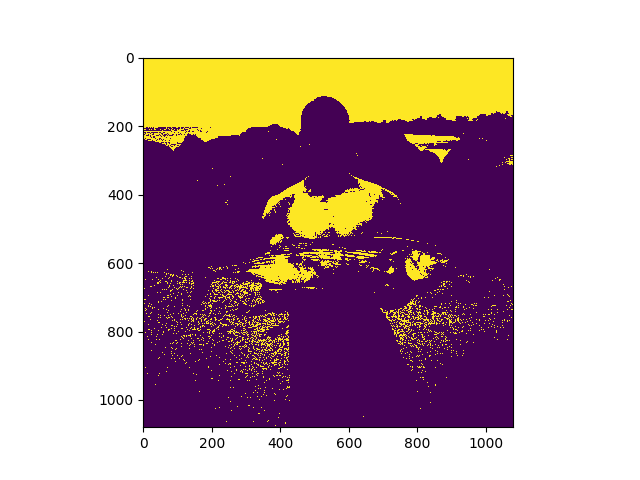
Resulting otsu image looks like this:

enter image description here

Here is the fish image (It has a shirtless guy holding a fish so may not be safe for work):

Link : https://i.sstatic.net/EDTem.jpg

EDIT:

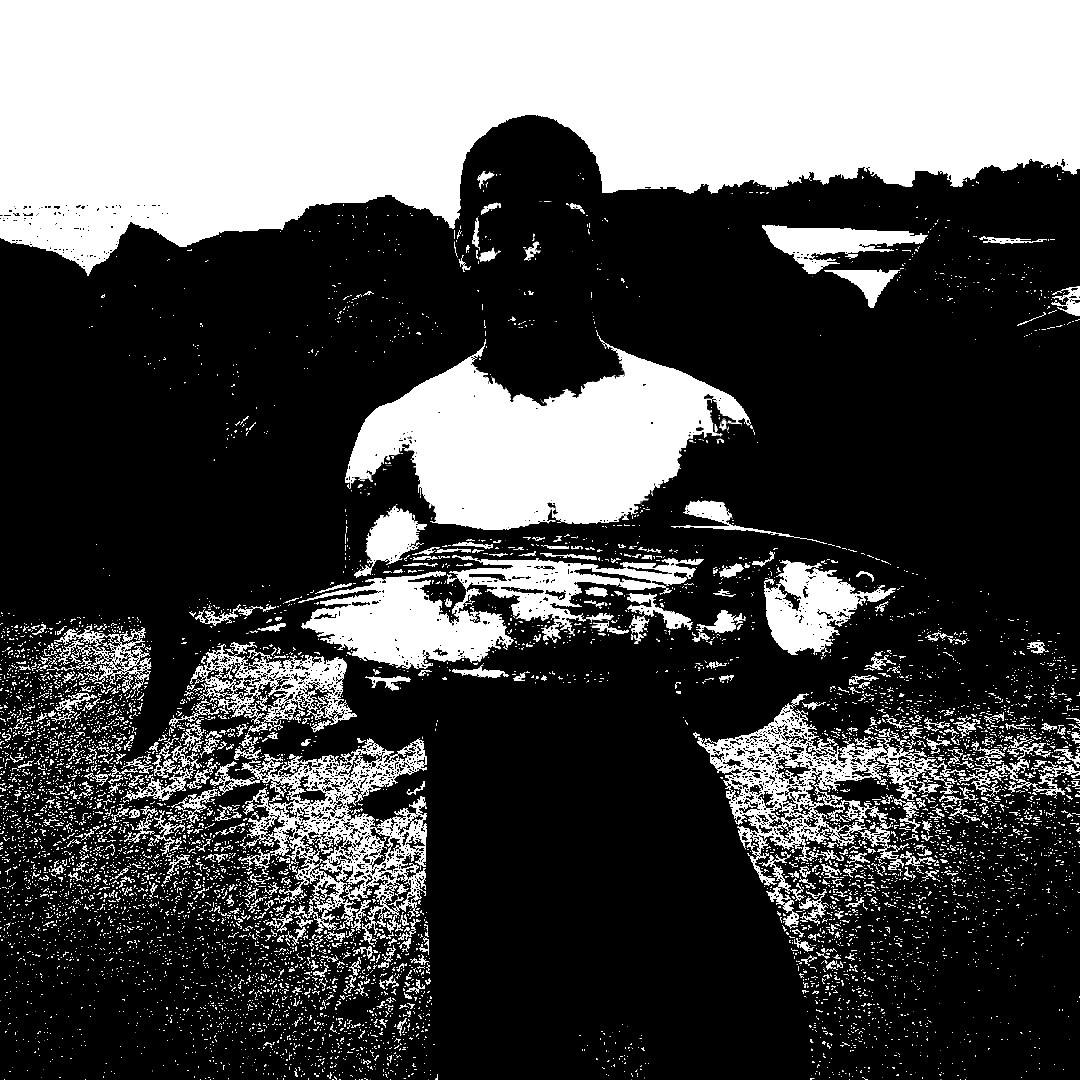
It turns out that by changing the threshold to 255 (The differences are more pronounced)

enter image description here

Overload answered 11/1, 2018 at 18:2 Comment(7)
You are showing us a color image but Otsu deals with grayscale images. And how the hell do you know that the threshold should be 170 ?Regatta
This is not the right way to threshold: otsu_img[otsu_img > keys['pixel']]=1 and otsu_img[otsu_img < keys['pixel']]=0. What you're doing here is setting all pixels above your threshold (let's say 130) to 1. Next you're finding all pixels below 130, including those you just set to 1, and setting them to 0. What you've got left is all pixels with a value of exactly 130. The rest is 0. Also, you're doing this on a color image, meaning you are thresholding the three channels separately and re-composing it as an RGB image. Convert to a gray-value image first!Glasses
Regarding your implementation of Otsu, it is supposed to be more efficient than this. Read here: en.wikipedia.org/wiki/Otsu%27s_method . In short, at each loop iteration, you can update the estimated means and variances, rather than computing them from all bins in every iteration. This changes the algorithm from O(n*^2) to O(*n) (with n the number of bins in the histogram, admittedly not a large value).Glasses
@YvesDaoust The image is being converted to gray-scale in the code.Overload
@CrisLuengo I converted the image to gray-values in the first function though.Overload
Oh, sorry, didn't see that. So the colors in the output are because of a color map? Makes sense.Glasses
@CrisLuengo Yeah, I just need to add cmap = 'gray' to plt.show() to have it output in black and white.Overload
E
5

I dont know if my implementation is alright. But this is what I got:

def otsu(gray):
    pixel_number = gray.shape[0] * gray.shape[1]
    mean_weigth = 1.0/pixel_number
    his, bins = np.histogram(gray, np.array(range(0, 256)))
    final_thresh = -1
    final_value = -1
    for t in bins[1:-1]: # This goes from 1 to 254 uint8 range (Pretty sure wont be those values)
        Wb = np.sum(his[:t]) * mean_weigth
        Wf = np.sum(his[t:]) * mean_weigth

        mub = np.mean(his[:t])
        muf = np.mean(his[t:])

        value = Wb * Wf * (mub - muf) ** 2

        print("Wb", Wb, "Wf", Wf)
        print("t", t, "value", value)

        if value > final_value:
            final_thresh = t
            final_value = value
    final_img = gray.copy()
    print(final_thresh)
    final_img[gray > final_thresh] = 255
    final_img[gray < final_thresh] = 0
    return final_img

Otsu image

Eonian answered 11/1, 2018 at 18:48 Comment(4)
Yeah, this looks correct. I will look over the code shortly. Thank you. Ah. I see that by changing the threshold to 255. I get a similar image. Except instead of white, I get yellow.Overload
BTW, what did you get as the final_threshold?Overload
@Overload It was 116Unclog
Just stumbled upon this code. It looks great but I think that you should write "his, bins = np.histogram(gray, np.array(range(0, 257)))" for a 255 image as you want to have 256 edges since you passed a list of numbers to the bins parameter.Cult
C
14

I used the implementation @Jose A in posted answer, which tries to maximize the interclass variance. It looks like jose has forgotten to multiply intensity level to their respective intensity pixel counts (in order to calculate mean), So I corrected the calculation of background mean mub and foreground mean muf. I am posting this as an answer and also trying to edit the accepted answer.

def otsu(gray):
    pixel_number = gray.shape[0] * gray.shape[1]
    mean_weight = 1.0/pixel_number
    his, bins = np.histogram(gray, np.arange(0,257))
    final_thresh = -1
    final_value = -1
    intensity_arr = np.arange(256)
    for t in bins[1:-1]: # This goes from 1 to 254 uint8 range (Pretty sure wont be those values)
        pcb = np.sum(his[:t])
        pcf = np.sum(his[t:])
        Wb = pcb * mean_weight
        Wf = pcf * mean_weight

        mub = np.sum(intensity_arr[:t]*his[:t]) / float(pcb)
        muf = np.sum(intensity_arr[t:]*his[t:]) / float(pcf)
        #print mub, muf
        value = Wb * Wf * (mub - muf) ** 2

        if value > final_value:
            final_thresh = t
            final_value = value
    final_img = gray.copy()
    print(final_thresh)
    final_img[gray > final_thresh] = 255
    final_img[gray < final_thresh] = 0
    return final_img
Cannikin answered 11/6, 2018 at 10:55 Comment(0)
E
5

I dont know if my implementation is alright. But this is what I got:

def otsu(gray):
    pixel_number = gray.shape[0] * gray.shape[1]
    mean_weigth = 1.0/pixel_number
    his, bins = np.histogram(gray, np.array(range(0, 256)))
    final_thresh = -1
    final_value = -1
    for t in bins[1:-1]: # This goes from 1 to 254 uint8 range (Pretty sure wont be those values)
        Wb = np.sum(his[:t]) * mean_weigth
        Wf = np.sum(his[t:]) * mean_weigth

        mub = np.mean(his[:t])
        muf = np.mean(his[t:])

        value = Wb * Wf * (mub - muf) ** 2

        print("Wb", Wb, "Wf", Wf)
        print("t", t, "value", value)

        if value > final_value:
            final_thresh = t
            final_value = value
    final_img = gray.copy()
    print(final_thresh)
    final_img[gray > final_thresh] = 255
    final_img[gray < final_thresh] = 0
    return final_img

Otsu image

Eonian answered 11/1, 2018 at 18:48 Comment(4)
Yeah, this looks correct. I will look over the code shortly. Thank you. Ah. I see that by changing the threshold to 255. I get a similar image. Except instead of white, I get yellow.Overload
BTW, what did you get as the final_threshold?Overload
@Overload It was 116Unclog
Just stumbled upon this code. It looks great but I think that you should write "his, bins = np.histogram(gray, np.array(range(0, 257)))" for a 255 image as you want to have 256 edges since you passed a list of numbers to the bins parameter.Cult
T
0

Here is another implementation I just modified from the scikit image source code. It's designed for 1-d arrays, so you'll have to write a wrapper to make it work with images.

def threshold_otsu(x: Iterable, *args, **kwargs) -> float:
    """Find the threshold value for a bimodal histogram using the Otsu method.

    If you have a distribution that is bimodal (AKA with two peaks, with a valley
    between them), then you can use this to find the location of that valley, that
    splits the distribution into two.

    From the SciKit Image threshold_otsu implementation:
    https://github.com/scikit-image/scikit-image/blob/70fa904eee9ef370c824427798302551df57afa1/skimage/filters/thresholding.py#L312
    """
    counts, bin_edges = np.histogram(x, *args, **kwargs)
    bin_centers = (bin_edges[1:] + bin_edges[:-1]) / 2

    # class probabilities for all possible thresholds
    weight1 = np.cumsum(counts)
    weight2 = np.cumsum(counts[::-1])[::-1]
    # class means for all possible thresholds
    mean1 = np.cumsum(counts * bin_centers) / weight1
    mean2 = (np.cumsum((counts * bin_centers)[::-1]) / weight2[::-1])[::-1]

    # Clip ends to align class 1 and class 2 variables:
    # The last value of ``weight1``/``mean1`` should pair with zero values in
    # ``weight2``/``mean2``, which do not exist.
    variance12 = weight1[:-1] * weight2[1:] * (mean1[:-1] - mean2[1:]) ** 2

    idx = np.argmax(variance12)
    threshold = bin_centers[idx]
    return threshold
Tomasz answered 4/3, 2022 at 2:17 Comment(0)

© 2022 - 2024 — McMap. All rights reserved.