Hello I have an app in Spring Boot and I am exposing some metrics on Prometheus. My next goal is to provide these metrics on Grafana in order to obtain some beautiful dashboards. I am using docker on WSL Ubuntu and typed the next commands for Prometheus and Grafana:
docker run -d --name=prometheus -p 9090:9090 -v /mnt/d/Projects/Msc-Thesis-Project/prometheus.yml:/etc/prometheus/prometheus.yml prom/prometheus --config.file=/etc/prometheus/prometheus.yml
docker run -d --name=grafana -p 3000:3000 grafana/grafana
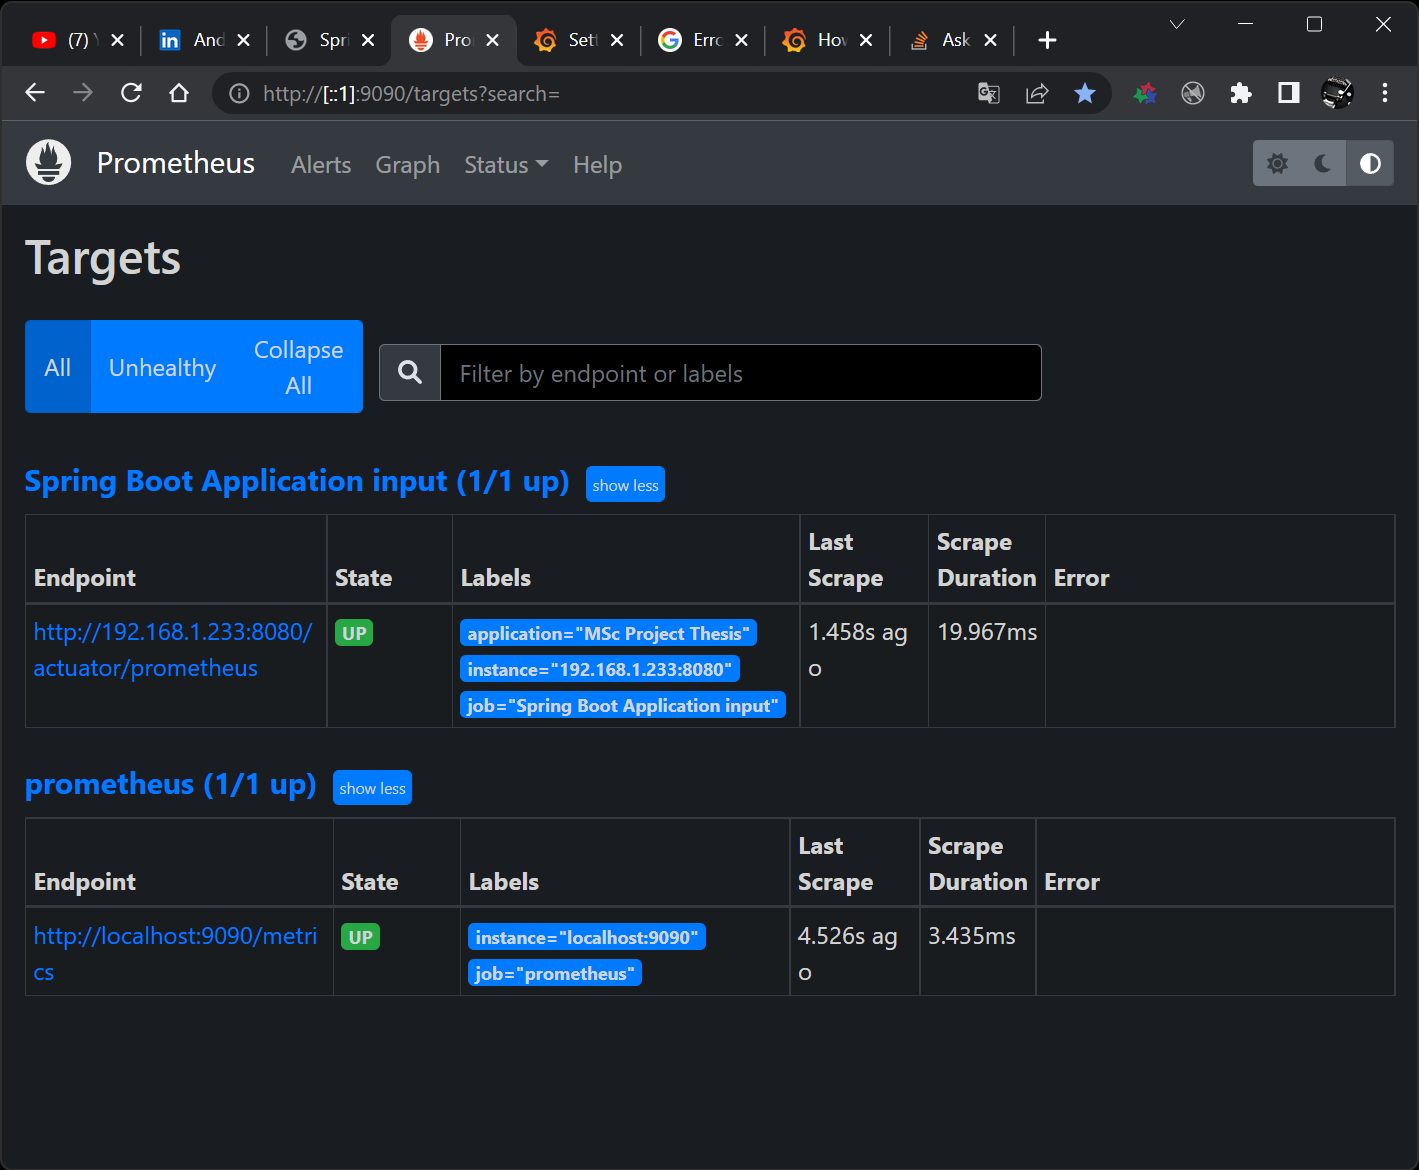
Below I am giving you the Prometheus dashboard in my browser and as you can see, everything is up and running. My problem is in Grafana configuration where I have to configure Prometheus as Data Source.
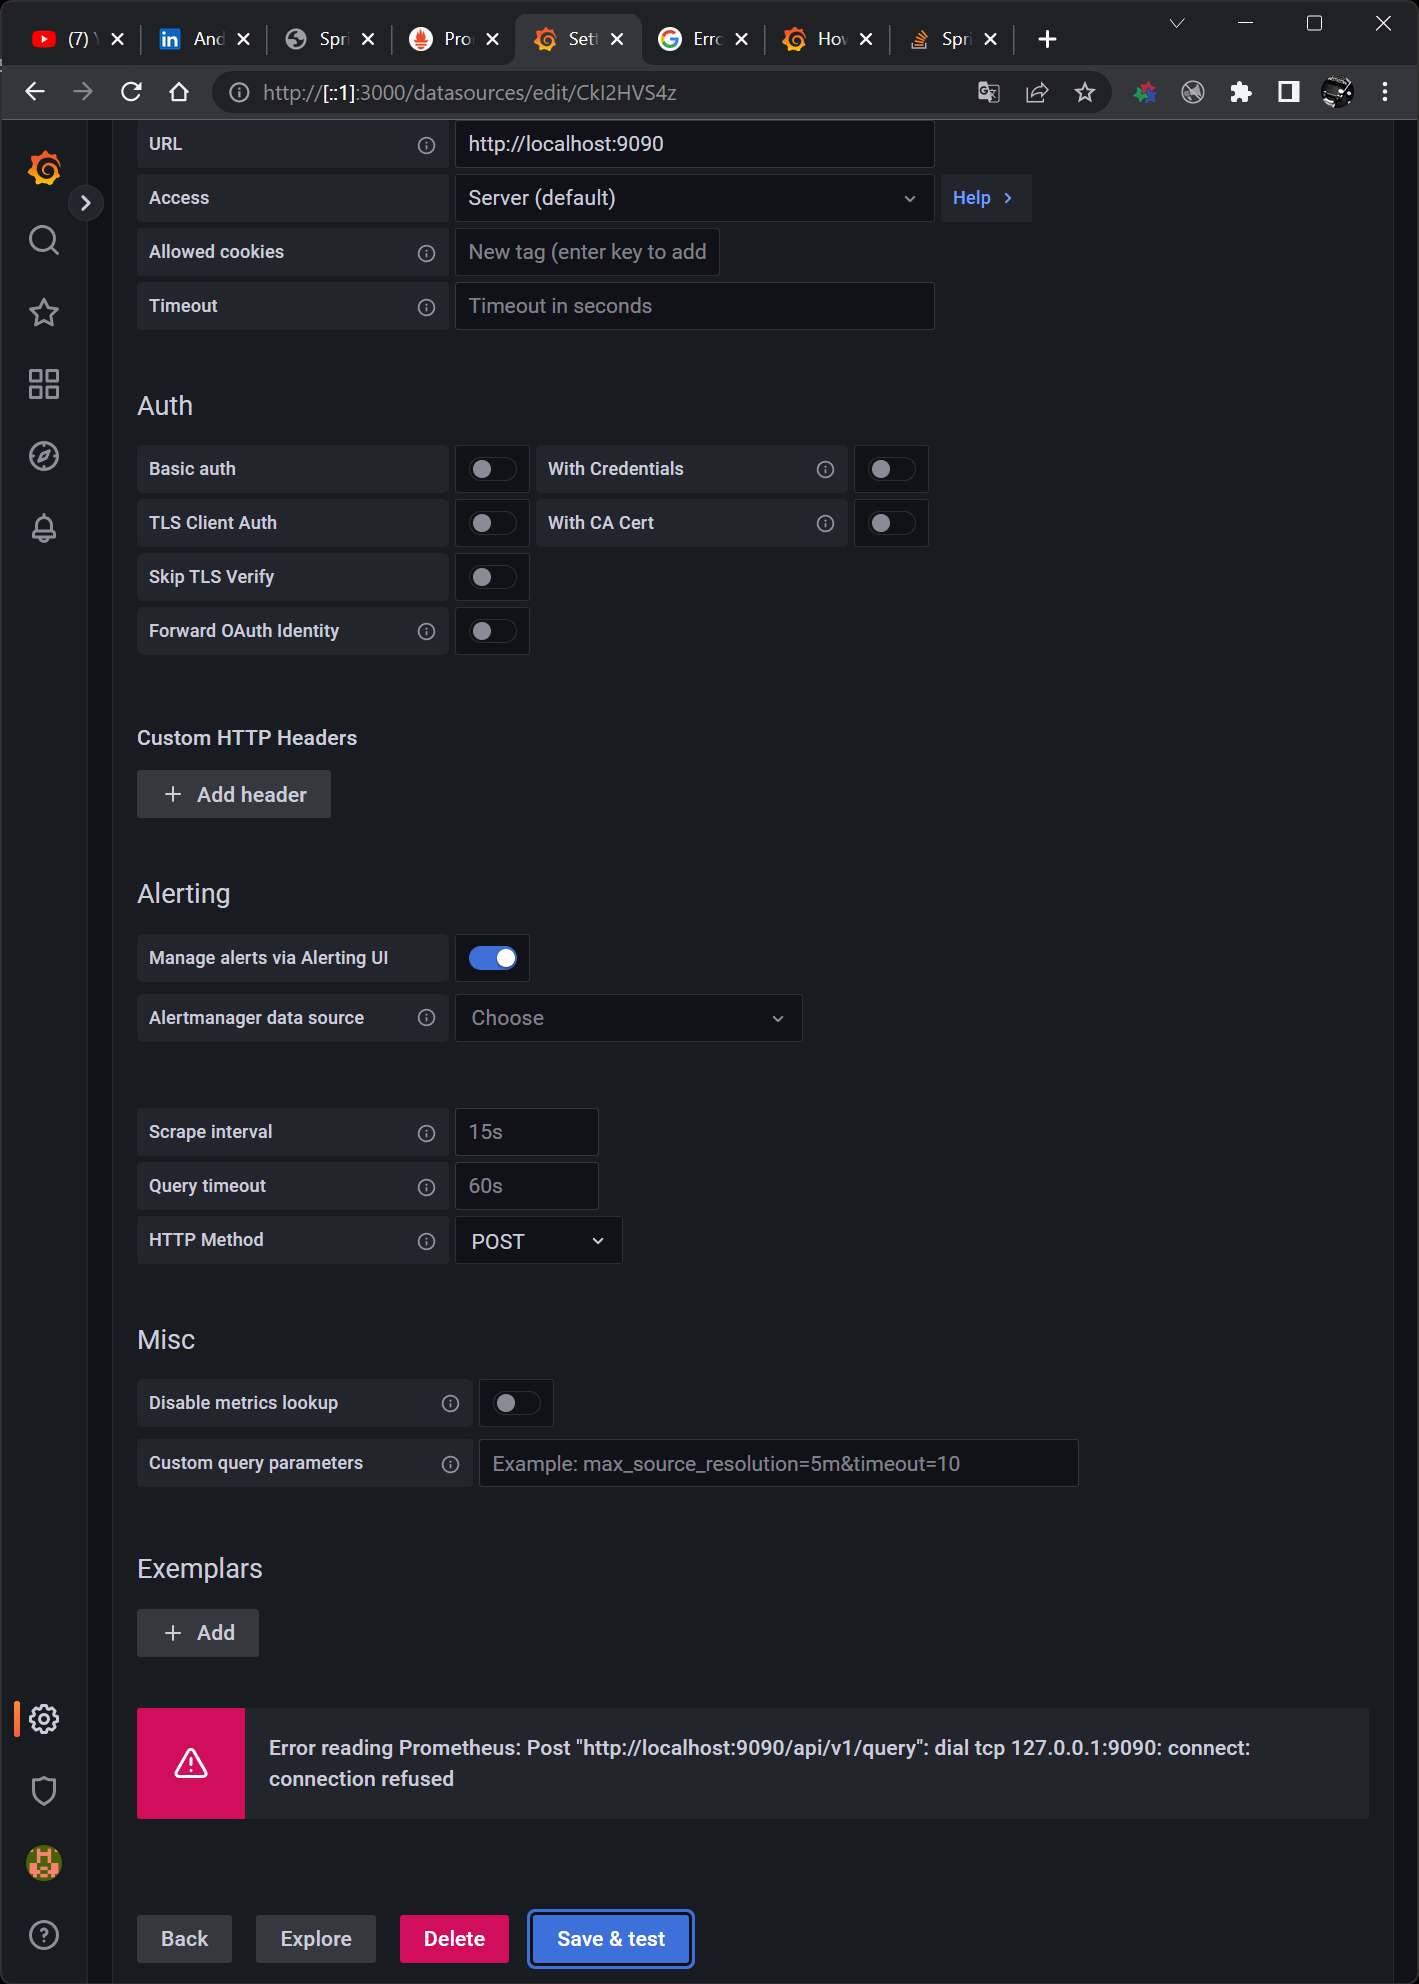
In the field URL I am providing the http://localhost:9090 but I am getting the following error:
Error reading Prometheus: Post "http://localhost:9090/api/v1/query": dial tcp 127.0.0.1:9090: connect: connection refused
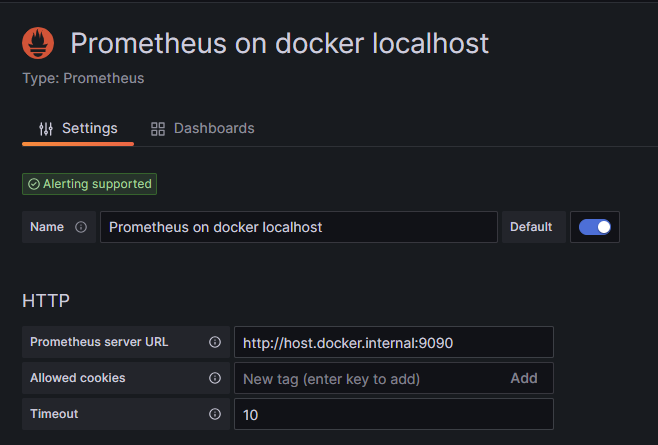
I've searched everywhere and saw some workarounds that don't apply to me. To be specific I used the following: http://host.docker.internal:9090, http://server-ip:9090 and of course my system's IP address via the ipconfig command http://<ip_address>:9090. Nothing works!!!
I am not using docker-compose but just a prometheus.yml file which is as follows.
global:
  scrape_interval:     15s
  evaluation_interval: 15s

scrape_configs:

  - job_name: 'prometheus'
    scrape_interval: 5s
    static_configs:
      - targets: ['localhost:9090']

  - job_name: 'Spring Boot Application input'
    metrics_path: '/actuator/prometheus'
    scrape_interval: 2s
    scheme: http
    static_configs:
      - targets: ['192.168.1.233:8080']
        labels:
          application: "MSc Project Thesis"
Can you advise me something?


