I have two different queries that take about the same amount of time to execute when I timed with Adminer or DBeaver
Query one
select * from state where state_name = 'Florida';
When I run the query above in Adminer it takes anywhere from
0.032 s to 0.058 s
EXPLAIN ANALYZE
Seq Scan on state  (cost=0.00..3981.50 rows=1 width=28) (actual time=1.787..15.047 rows=1 loops=1)
  Filter: (state_name = 'Florida'::citext)
  Rows Removed by Filter: 50
Planning Time: 0.486 ms
Execution Time: 15.779 ms
Query two
select
    property.id as property_id ,
    full_address,
    street_address,
    street.street,
    city.city as city,
    state.state_code as state_code,
    zipcode.zipcode as zipcode
from
    property
inner join street on
    street.id = property.street_id
inner join city on
    city.id = property.city_id
inner join state on
    state.id = property.state_id
inner join zipcode on
    zipcode.id = property.zipcode_id
where
    full_address = '139-Skillman-Ave-Apt-5C-Brooklyn-NY-11211';
The above query takes from
0.025 s to 0.048 s
EXPLAIN ANALYZE
Nested Loop  (cost=29.82..65.96 rows=1 width=97) (actual time=0.668..0.671 rows=1 loops=1)
  ->  Nested Loop  (cost=29.53..57.65 rows=1 width=107) (actual time=0.617..0.620 rows=1 loops=1)
        ->  Nested Loop  (cost=29.25..49.30 rows=1 width=120) (actual time=0.582..0.585 rows=1 loops=1)
              ->  Nested Loop  (cost=28.97..41.00 rows=1 width=127) (actual time=0.532..0.534 rows=1 loops=1)
                    ->  Bitmap Heap Scan on property  (cost=28.54..32.56 rows=1 width=131) (actual time=0.454..0.456 rows=1 loops=1)
                          Recheck Cond: (full_address = '139-Skillman-Ave-Apt-5C-Brooklyn-NY-11211'::citext)
                          Heap Blocks: exact=1
                          ->  Bitmap Index Scan on property_full_address  (cost=0.00..28.54 rows=1 width=0) (actual time=0.426..0.426 rows=1 loops=1)
                                Index Cond: (full_address = '139-Skillman-Ave-Apt-5C-Brooklyn-NY-11211'::citext)
                    ->  Index Scan using street_pkey on street  (cost=0.42..8.44 rows=1 width=28) (actual time=0.070..0.070 rows=1 loops=1)
                          Index Cond: (id = property.street_id)
              ->  Index Scan using city_id_pk on city  (cost=0.29..8.30 rows=1 width=25) (actual time=0.047..0.047 rows=1 loops=1)
                    Index Cond: (id = property.city_id)
        ->  Index Scan using state_id_pk on state  (cost=0.28..8.32 rows=1 width=19) (actual time=0.032..0.032 rows=1 loops=1)
              Index Cond: (id = property.state_id)
  ->  Index Scan using zipcode_id_pk on zipcode  (cost=0.29..8.30 rows=1 width=22) (actual time=0.048..0.048 rows=1 loops=1)
        Index Cond: (id = property.zipcode_id)
Planning Time: 5.473 ms
Execution Time: 1.601 ms
I have the following methods which uses JDBCTemplate to execute the same queries.
Query one
public void performanceTest(String str) {
    template.queryForObject(
            "select * from state where state_name = ?",
            new Object[] { str }, (result, rowNum) -> {
                return result.getObject("state_name");
            });

}
time: 140ms, which is 0.14 seconds
Query two
public void performanceTest(String str) {
    template.queryForObject(
            "SELECT property.id AS property_id , full_address, street_address, street.street, city.city as city, state.state_code as state_code, zipcode.zipcode as zipcode FROM property INNER JOIN street ON street.id = property.street_id INNER JOIN city ON city.id = property.city_id INNER JOIN state ON state.id = property.state_id INNER JOIN zipcode ON zipcode.id = property.zipcode_id WHERE full_address = ?",
            new Object[] { str }, (result, rowNum) -> {
                return result.getObject("property_id");
            });

}
The time it takes to execute the method above is
time: 828 ms, which is 0.825 seconds
I am timing the method's execution time using this code below
long startTime1 = System.nanoTime();
propertyRepo.performanceTest(address); //or "Florida" depending which query I'm testing
long endTime1 = System.nanoTime();
long duration1 = TimeUnit.MILLISECONDS.convert((endTime1 - startTime1), TimeUnit.NANOSECONDS);
System.out.println("time: " + duration1);
Why is query two so much slower when I run it from JDBC compared to when I run it from Adminer? Anything I can do to improve the performance for query two?
EDIT:
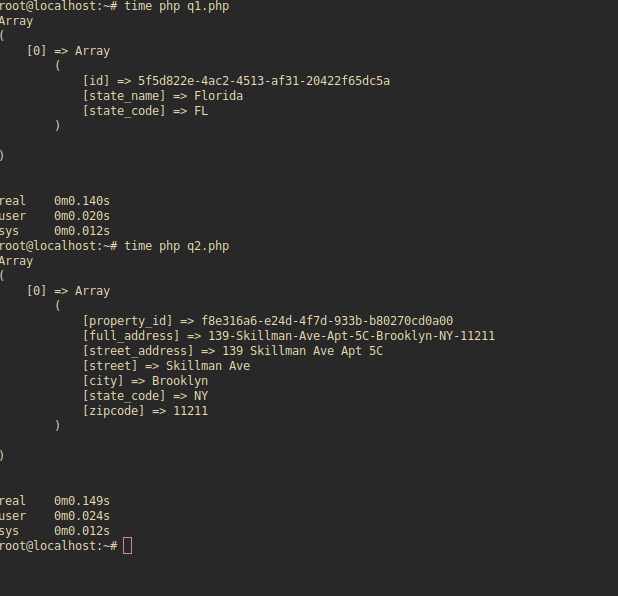
I created two different PHP scripts containing the queries respectively. They take the same amount of time using PHP, so I assume it has something to do with JDBC? Below is the result of the PHP scripts. The time PHP takes is a higher than Java takes with Query one since I am not using any connection pooling. But both queries are taking pretty much the same amount of time to execute. Something is causing a delay with Query two on JDBC.
EDIT:
When I run the query using prepared statement it's slow. But it's fast when I run it with statement. I did EXPLAIN ANALYZE for both, using preparedStatement and statement
preparedStatement explain analyze
Nested Loop  (cost=1.27..315241.91 rows=1 width=97) (actual time=0.091..688.583 rows=1 loops=1)
  ->  Nested Loop  (cost=0.98..315233.61 rows=1 width=107) (actual time=0.079..688.571 rows=1 loops=1)
        ->  Nested Loop  (cost=0.71..315225.26 rows=1 width=120) (actual time=0.069..688.561 rows=1 loops=1)
              ->  Nested Loop  (cost=0.42..315216.95 rows=1 width=127) (actual time=0.057..688.548 rows=1 loops=1)
                    ->  Seq Scan on property  (cost=0.00..315208.51 rows=1 width=131) (actual time=0.032..688.522 rows=1 loops=1)
                          Filter: ((full_address)::text = '139-Skillman-Ave-Apt-5C-Brooklyn-NY-11211'::text)
                          Rows Removed by Filter: 8790
                    ->  Index Scan using street_pkey on street  (cost=0.42..8.44 rows=1 width=28) (actual time=0.019..0.019 rows=1 loops=1)
                          Index Cond: (id = property.street_id)
              ->  Index Scan using city_id_pk on city  (cost=0.29..8.30 rows=1 width=25) (actual time=0.010..0.010 rows=1 loops=1)
                    Index Cond: (id = property.city_id)
        ->  Index Scan using state_id_pk on state  (cost=0.28..8.32 rows=1 width=19) (actual time=0.008..0.008 rows=1 loops=1)
              Index Cond: (id = property.state_id)
  ->  Index Scan using zipcode_id_pk on zipcode  (cost=0.29..8.30 rows=1 width=22) (actual time=0.010..0.010 rows=1 loops=1)
        Index Cond: (id = property.zipcode_id)
Planning Time: 2.400 ms
Execution Time: 688.674 ms
statement explain analyze
Nested Loop  (cost=29.82..65.96 rows=1 width=97) (actual time=0.232..0.235 rows=1 loops=1)
  ->  Nested Loop  (cost=29.53..57.65 rows=1 width=107) (actual time=0.220..0.223 rows=1 loops=1)
        ->  Nested Loop  (cost=29.25..49.30 rows=1 width=120) (actual time=0.211..0.213 rows=1 loops=1)
              ->  Nested Loop  (cost=28.97..41.00 rows=1 width=127) (actual time=0.198..0.200 rows=1 loops=1)
                    ->  Bitmap Heap Scan on property  (cost=28.54..32.56 rows=1 width=131) (actual time=0.175..0.177 rows=1 loops=1)
                          Recheck Cond: (full_address = '139-Skillman-Ave-Apt-5C-Brooklyn-NY-11211'::citext)
                          Heap Blocks: exact=1
                          ->  Bitmap Index Scan on property_full_address  (cost=0.00..28.54 rows=1 width=0) (actual time=0.162..0.162 rows=1 loops=1)
                                Index Cond: (full_address = '139-Skillman-Ave-Apt-5C-Brooklyn-NY-11211'::citext)
                    ->  Index Scan using street_pkey on street  (cost=0.42..8.44 rows=1 width=28) (actual time=0.017..0.017 rows=1 loops=1)
                          Index Cond: (id = property.street_id)
              ->  Index Scan using city_id_pk on city  (cost=0.29..8.30 rows=1 width=25) (actual time=0.010..0.010 rows=1 loops=1)
                    Index Cond: (id = property.city_id)
        ->  Index Scan using state_id_pk on state  (cost=0.28..8.32 rows=1 width=19) (actual time=0.007..0.007 rows=1 loops=1)
              Index Cond: (id = property.state_id)
  ->  Index Scan using zipcode_id_pk on zipcode  (cost=0.29..8.30 rows=1 width=22) (actual time=0.010..0.010 rows=1 loops=1)
        Index Cond: (id = property.zipcode_id)
Planning Time: 2.442 ms
Execution Time: 0.345 ms


EXPLAIN ANALYZEif it helps. – Promiscuousfull_address(and not a literal string). I suspect you will see a different plan. Alternatively you may test the literal string usage in JDBCTemplate query. – Aerobatics