Why is event count higher in BigQuery than GA4 UI
Asked Answered
A

4

6

I am working with GA4 data in Bigquery and am attempting to validate against the numbers I see in the Google Analytic UI. In each case, the BigQuery count of events is a little under double that shown in GA4. Any idea why this might me? Should I be counting events another way than just counting the number of Bigquery event rows?

EXAMPLE:

I testing this with as basic a query as possible, counting all leads from 20th May 2023.

SELECT COUNT(*) FROM `mydataset.events_20230520`

Giving me 100690 events in BigQuery

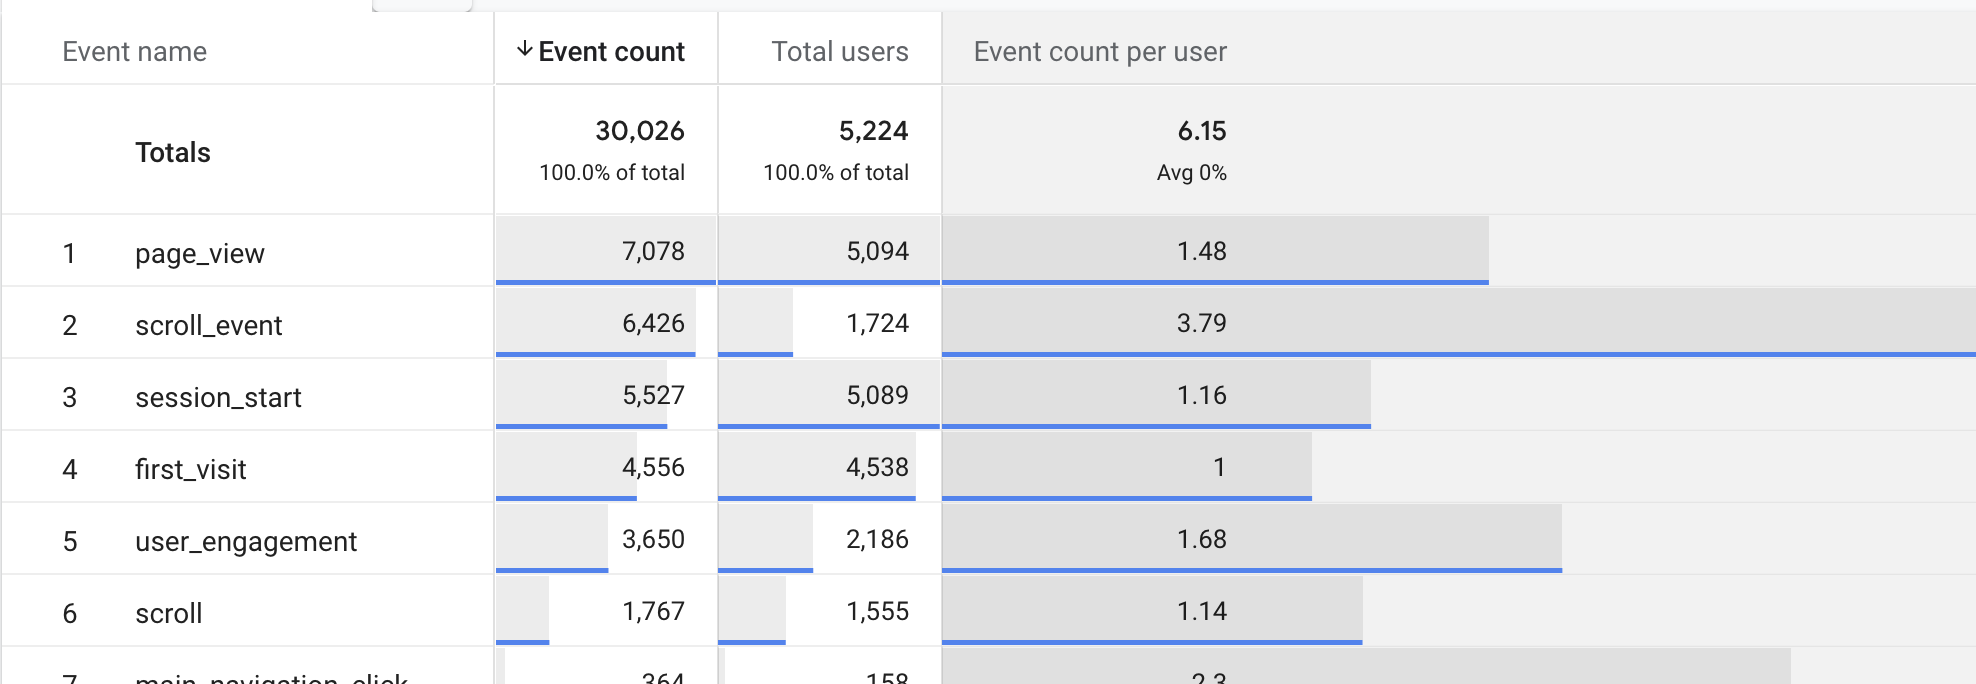
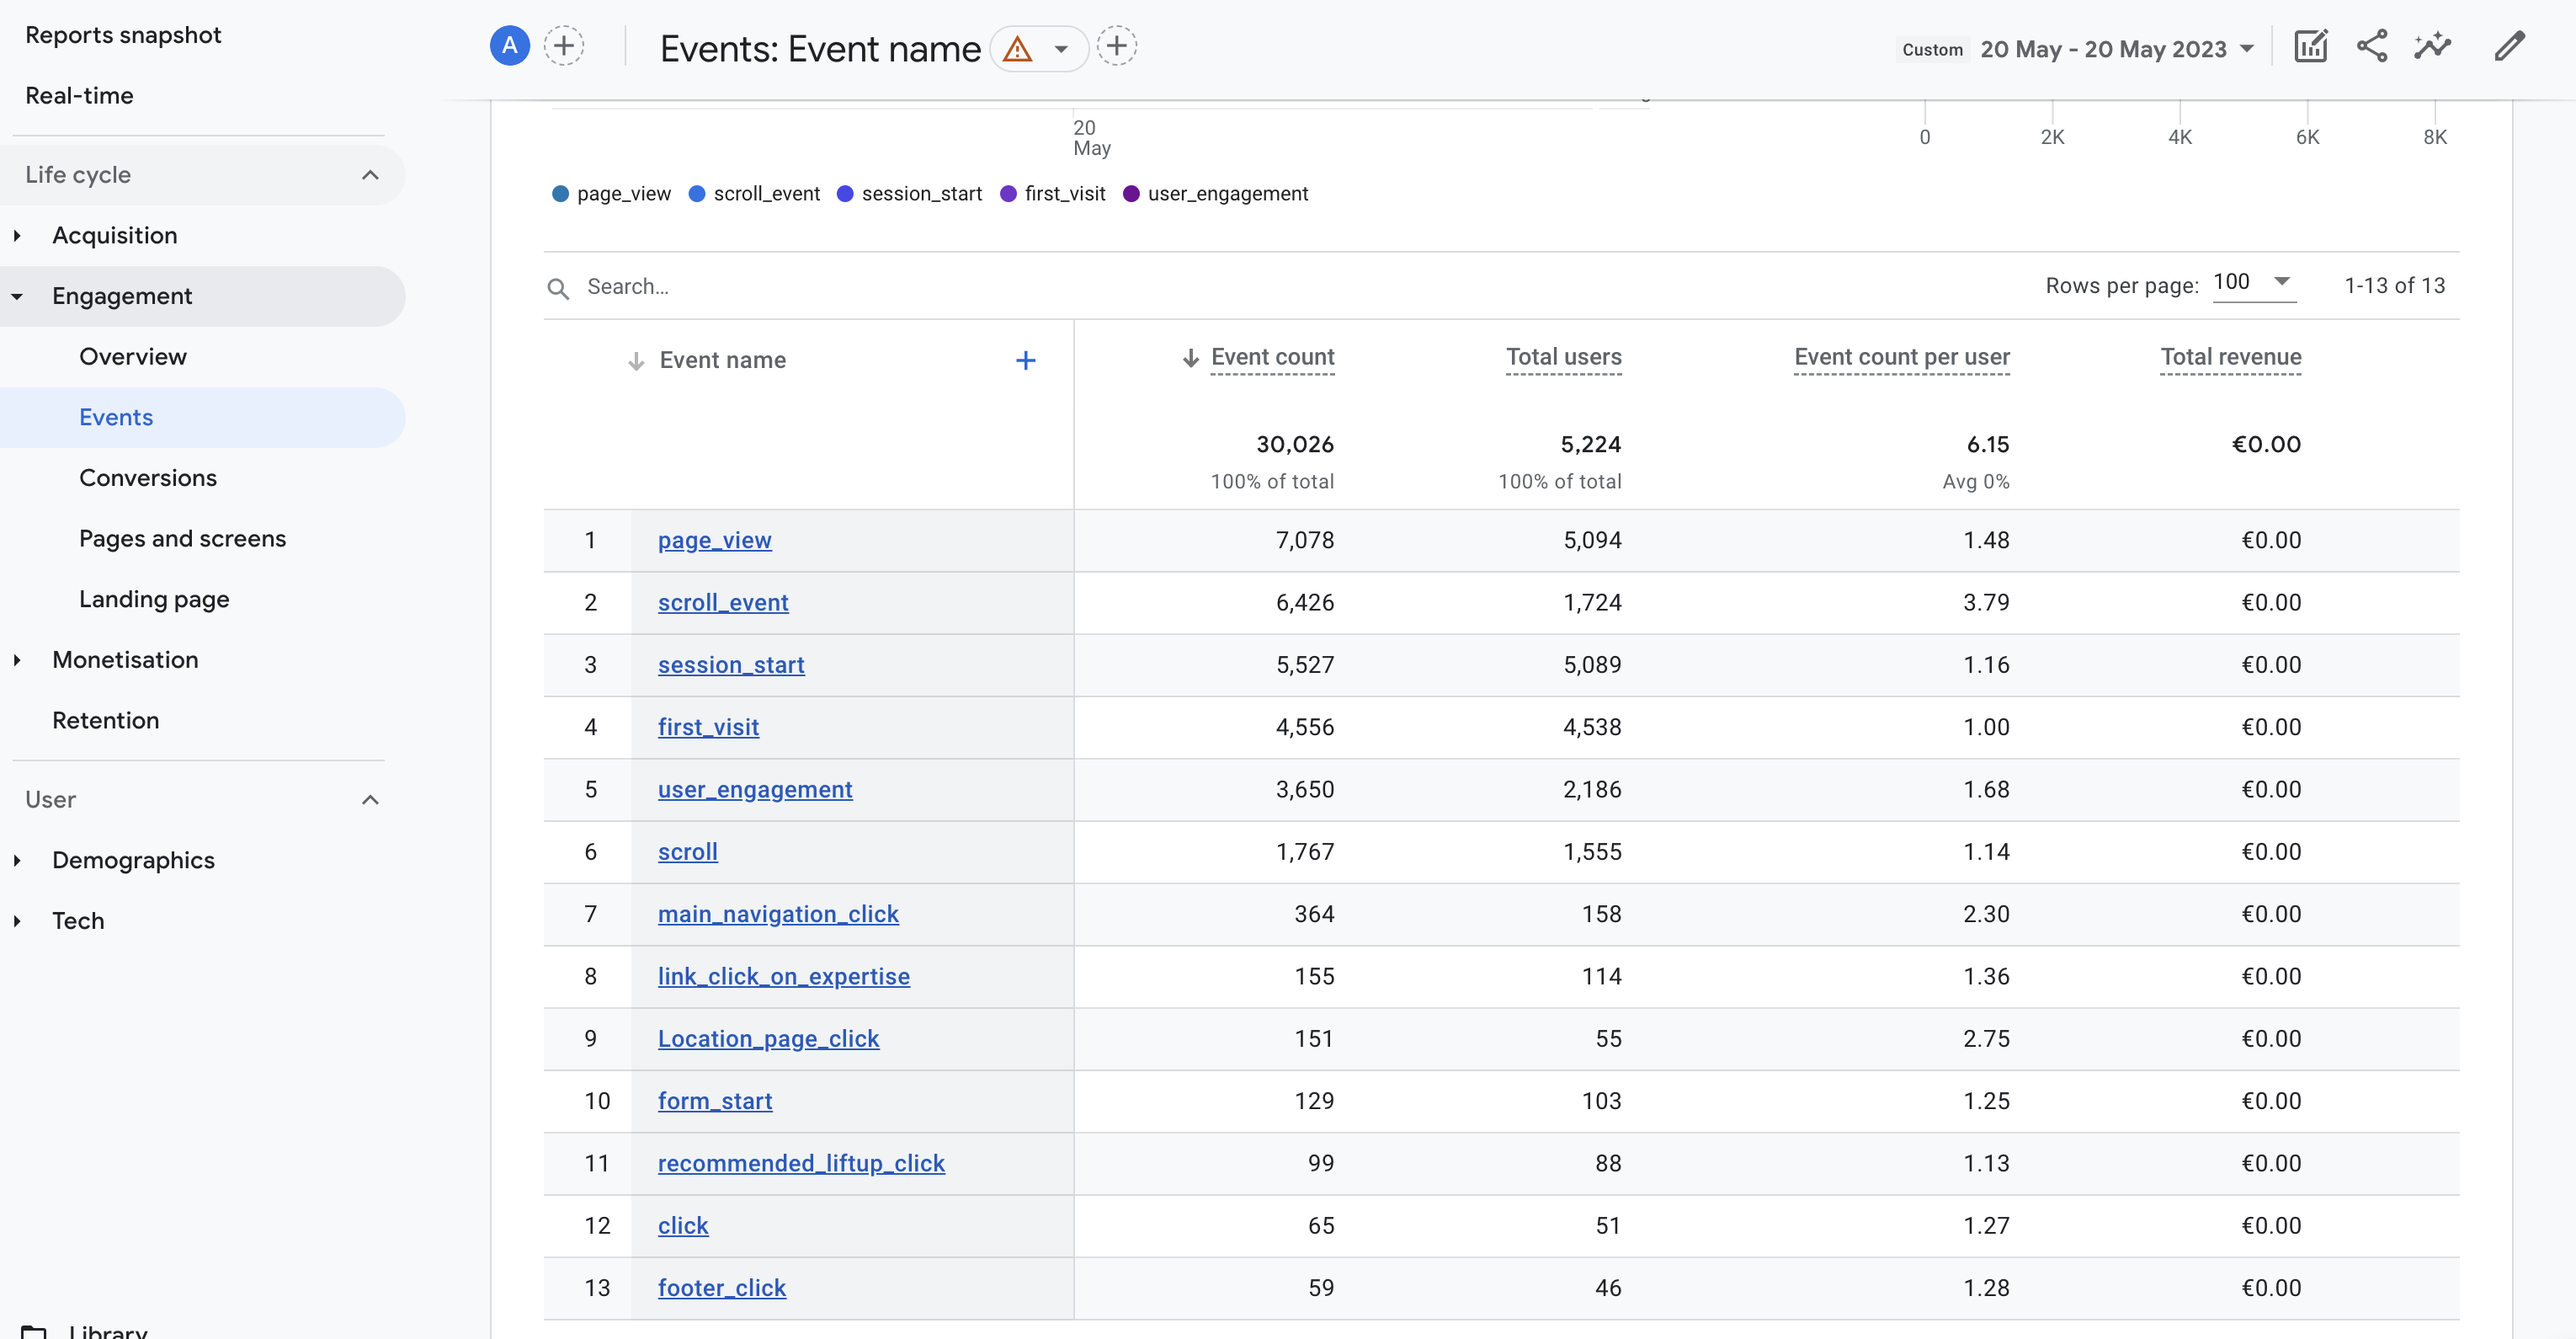
GA4 UI event count for the same day is 30000

So BigQuery is reporting over 3X the number of events than GA4.

ENGAGEMENT > EVENTS REPORT VIEQ enter image description here
SAME PERIOD BIGQUERY enter image description here

Interestingly I look at Acquisition > User Acquisition and query the same figures in BigQuery, I see the New Users, Engaged Session, and Engagement Rate are all correct but the Event Count is still roughly 3X larger in in BigQuery.

enter image description here

This issue holds true for and report I duplicate in BigQuery. Everything except Event Count is close to matching and Event Count is always around 3X larger in BigQuery.

ADDITION:

rebuilt analysis in Explore as suggested in the comments, but again the results are exactly the same as the report

NO matter which way round I look at it BigQuery reports over 3X the number of events.

Am I counting events incorrectly? How is GA4 counting events? Is there some event types I should be ignoring when counting the total?

enter image description here

Adynamia answered 24/5, 2023 at 22:30 Comment(9)
Can you post an example query, query results, and UI count?Selima
Thanks @MinhazKazi. I have added an example to the question. Note I do have Google Signals enabled, which I understand can make some difference, but I am guessing not this much.Adynamia
Could you please post a screenshot of the event count from the GA UI? I'm trying understand which report you are using.Selima
@MinhazKazi Added screenshot it is the Engagement > Events reportAdynamia
@MinhazKazi I have also a screenshot form BigQuery where I can see the the events are all reporting 3XAdynamia
Can you rebuild your analysis in the Explore rather than Reports and show the screenshot?Cess
@Cess Yes, but it shows the same numbersAdynamia
I don't have any answer right now. I suggest picking an event with low count (e.g. footer_click or video_play_all) and looking at all the records for that event in BigQuery to see if you can find any discrepancies or patterns.Selima
@MinhazKazi Interesting, the event count difference grows exponentially as the numbers increase. the difference in video_play events between BigQuery and GA4 Explorer is less than 2%. footer_click 34% difference, click 15.6%, scroll 87.1245%. It's not 100% consistent, as some event's are closer then others but this is the general trend.Adynamia
R
0

It's also worth pointing out that if you have Google signals enabled (in other words you are using the Observed identity in the GA4 UI), that BigQuery only imports data based of the Device Type identity. So that is likely to cause a lot of discrepancy as well.

"GA4 has four reporting identity spaces available for reporting. However, GA4 only exports data based on Device ID to BigQuery. If you have another reporting identity set in GA4, the comparison with BigQuery will be inaccurate.

Change your reporting ID to Device ID when comparing data, and then change back to another reporting identity after you finish. The option you choose does not affect data collection or processing. You can switch between the options at any time without making any permanent impact on data."

https://support.google.com/analytics/answer/13578783?hl=en#zippy=%2Cin-this-article

Recension answered 21/9, 2023 at 20:37 Comment(0)
P
0

See that (semi) red Exclamation mark near "Event name" in your first screenshot? I would guess that because of number of events, GA is sampling only part of all data.

This is example of how expanded description looks

This report is based on 61.6% of available data.

Phlyctena answered 14/2 at 12:55 Comment(0)
C
0

Due to sampling I'd say. Try expanding the date range of both to 3 days and see if the discrepencynis is the same. It should be less.

Caesarean answered 24/2 at 8:0 Comment(1)
Your answer could be improved with additional supporting information. Please edit to add further details, such as citations or documentation, so that others can confirm that your answer is correct. You can find more information on how to write good answers in the help center.Corregidor
C
-2

This article does a great job of putting together why they will differ.

In some additional research, there is a discrepancy as referenced here in how events are counted between BQ and GA and suggest the documentation here. From the document "If you do your calculations from BigQuery, you will always end up with the ground-truth data - the most granular rows." Greater clarity on GA4 can be found here. From a similar question where someone was seeing the opposite. The answer to this was: "Big Query is more precise whereas the GA4 browser uses estimates. Also, not all sessions are included in Big Query like Google Signals." As reported here also adds the issue of data thresholds.

In summary, it does not appear that Google built them to reconcile with each other (at least not easily), for better or for worse.

Commission answered 29/5, 2023 at 18:5 Comment(1)
Thanks for the answer. I am ware that the numbers will not exactly match due to Signal and a range of reasons in GA4, so I am not expecting them to match, but if there are 3X the number of events in BigQuery then reported in GA4, this isn't normal variants, as all other numbers vary only a amount, and they are generated from the same data, so I don't see how expected variants can be the issue.Adynamia

© 2022 - 2024 — McMap. All rights reserved.