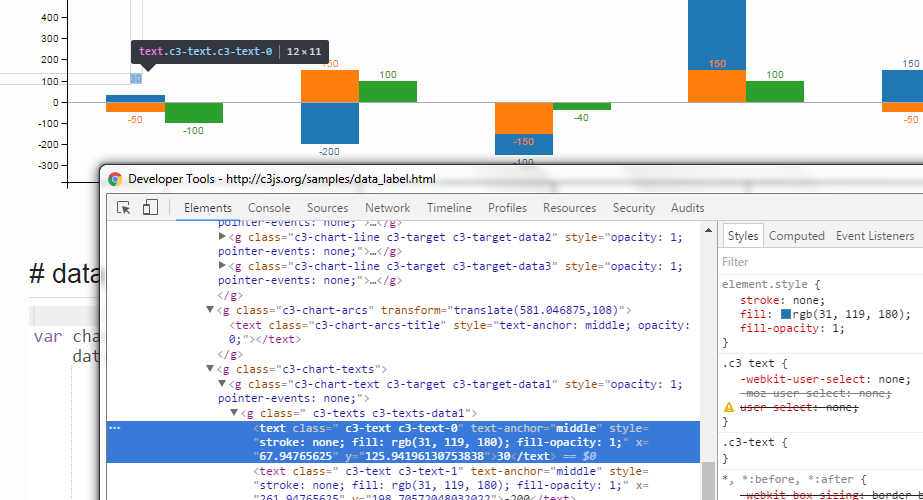
I've been searching the c3.js reference but couldn't find any setting that I can make the values appear in the bars. It's cool to have tooltips but it's easier in my situation to display values directly in the bar columns...
c3.js how to display values inside/at the top of the bars
Refer to following example:- c3js.org/samples/data_label.html –
Mize
Nice. Is there any way to put the label in the center of the bar? It looks odd in a stacked bar chart... See jsfiddle.net/tom15375/fy3tm98d –
Sulamith
You need to override certiain c3.js internal_functions to provide desired x,y corordinate values for the svg element which contains bar values as shown below:-
You don't need to override c3's source. Instead of that you can just add
labels: true to data in your c3.generate. –
Chameleon © 2022 - 2024 — McMap. All rights reserved.

