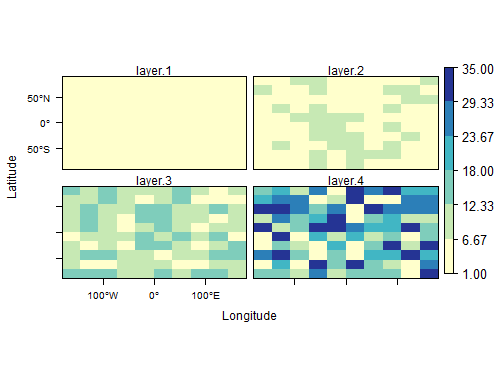
i have a raster stack of 7 rasters with quite varying data ranges and not all of the rasters adhere to quite the same range. (some are low value ranges, some much higher). Using the levelplot function with the stack, it plots nicely enough, eg:
r <- raster(ncol=10,nrow=10)
r[] <- sample(c(1:3),size=100,replace=T)
r1 <- raster(ncol=10,nrow=10)
r1[] <- sample(c(1:9),size=100,replace=T)
r2 <- raster(ncol=10,nrow=10)
r2[] <- sample(c(5:15),size=100,replace=T)
r3 <- raster(ncol=10,nrow=10)
r3[] <- sample(c(3:35),size=100,replace=T)
s <- stack(r,r1,r2,r3)

breaks <- 7
my.at <- round(seq(min(minValue(s)), max(maxValue(s)), length.out = breaks),digits=2)
myColorkey <- list(at=my.at,height=0.95, width=1, labels=list(at=my.at,cex=1.1))
cols <- (brewer.pal(length(my.at)-1, "YlGnBu"))
levelplot(s,at=my.at,col.regions=cols,colorkey = myColorkey)
As you can see, the images with the lower value data are one colour (Actually in my real data most of the plots are one colour as the data range is dominated by two latter rasters). Using the levelplot function, i would like to reclassify the entire raster stack, teasing out some patterns in the lower value rasters with some classes that i define and simply assign anything over value x (perhaps 10 in the sample data above) to be one colour.
the usual method of ratifying and setting levels will not work for a stack and any workaround i have tried (using a matrix and reclassify) will not force more levels than there are classes for a raster
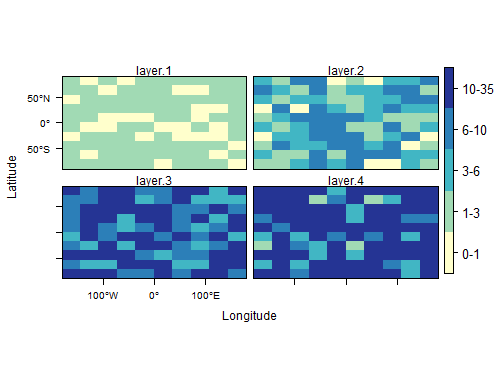
this is my workaround, using the standard legend, but i'd like to use ratify etc if possible;
# using s from above
m <- c(0,1,1,  1,3,2,  3,6,3,  6,10,4,  10,35,5)
mat <- matrix(m, ncol=3, byrow=TRUE)
src <- reclassify(s, mat)

breaks <- nrow(mat)
my.at <- (0:breaks)
myColorkey <- list(at=my.at,height=0.95, width=1, labels=list(at=my.at+0.5,labels=c("0-1","1-3","3-6","6-10","10-35"),cex=1.1))
cols <- (brewer.pal(length(my.at)-1, "YlGnBu"))

levelplot(src,at=my.at,col.regions=cols,colorkey = myColorkey)


