I want to group column names in an RMarkdown table for the Word/docx output.
Using pandoc.table:
library(pander)
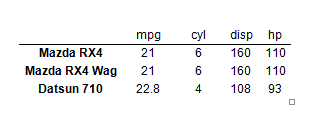
pandoc.table(mtcars[1:3, 1:4], style = "rmarkdown")

|                |  mpg  |  cyl  |  disp  |  hp  |
|:-------------------:|:-----:|:-----:|:------:|:----:|
|    **Mazda RX4**    |  21   |   6   |  160   | 110  |
|  **Mazda RX4 Wag**  |  21   |   6   |  160   | 110  |
|   **Datsun 710**    | 22.8  |   4   |  108   |  93  |
This produces the output below, which is fine
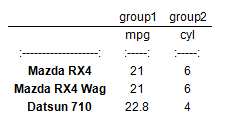
But, say I want to group mpg & cyl in one group, and disp & hp in another like so (modified by hand):
|                     |     group1    |     group2    |
|:-------------------:|:-------------:|:-------------:|
|                |  mpg  |  cyl  |  disp  |  hp  |
|:-------------------:|:-----:|:-----:|:------:|:----:|
|    **Mazda RX4**    |  21   |   6   |  160   | 110  |
|  **Mazda RX4 Wag**  |  21   |   6   |  160   | 110  |
|   **Datsun 710**    | 22.8  |   4   |  108   |  93  |
This won't work and the output looks like this:
If possible, I would also like to add the title in a merged top cell, like so (obviously this also does not work):
|**Table 1.** This is a table title ..........xxxxxx  |
|possibly wrapped to the next line.                   |
|:---------------------------------------------------:|
|                     |     group1    |     group2    |
|:-------------------:|:-------------:|:-------------:|
|                |  mpg  |  cyl  |  disp  |  hp  |
|:-------------------:|:-----:|:-----:|:------:|:----:|
|    **Mazda RX4**    |  21   |   6   |  160   | 110  |
|  **Mazda RX4 Wag**  |  21   |   6   |  160   | 110  |
|   **Datsun 710**    | 22.8  |   4   |  108   |  93  |


pander.CrossTable, but that's relatively tricky and not elegant at all. – Uxorialpander, are there any other alternatives? If not, could you still provide an example usingpander.CrossTable? – Percolationpanderlimitation, but limitation of the markdown specification. If your required output is Word/docx, you cannot use even use the more customizable HTML or LaTeX. An option is to do HTML output and import to Word, or check eg the ReporteRs package for Word output from R. – Uxorial