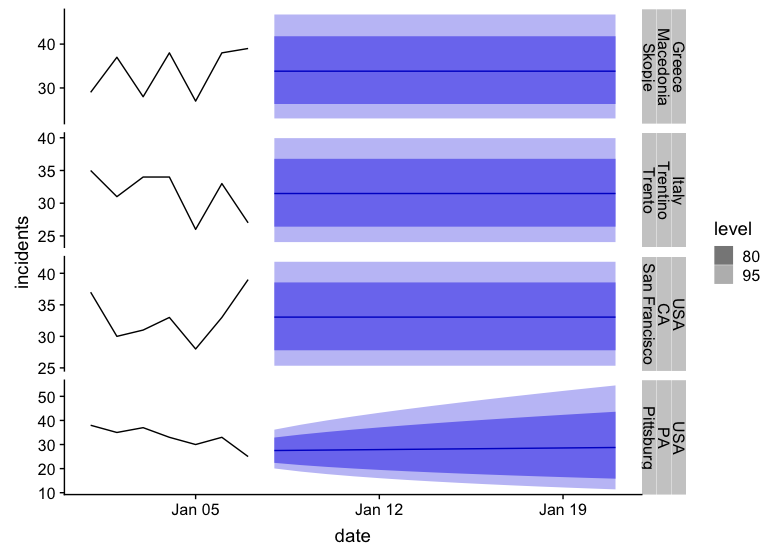
I have a time series data with a frequency = 7 as follows:
combo_1_daily_mini <-   read.table(header=TRUE, text="
region_1    region_2    region_3    date    incidents
USA CA  San Francisco   1/1/15  37
USA CA  San Francisco   1/2/15  30
USA CA  San Francisco   1/3/15  31
USA CA  San Francisco   1/4/15  33
USA CA  San Francisco   1/5/15  28
USA CA  San Francisco   1/6/15  33
USA CA  San Francisco   1/7/15  39
USA PA  Pittsburg   1/1/15  38
USA PA  Pittsburg   1/2/15  35
USA PA  Pittsburg   1/3/15  37
USA PA  Pittsburg   1/4/15  33
USA PA  Pittsburg   1/5/15  30
USA PA  Pittsburg   1/6/15  33
USA PA  Pittsburg   1/7/15  25
Greece  Macedonia   Skopje  1/1/15  29
Greece  Macedonia   Skopje  1/2/15  37
Greece  Macedonia   Skopje  1/3/15  28
Greece  Macedonia   Skopje  1/4/15  38
Greece  Macedonia   Skopje  1/5/15  27
Greece  Macedonia   Skopje  1/6/15  38
Greece  Macedonia   Skopje  1/7/15  39
Italy   Trentino    Trento  1/1/15  35
Italy   Trentino    Trento  1/2/15  31
Italy   Trentino    Trento  1/3/15  34
Italy   Trentino    Trento  1/4/15  34
Italy   Trentino    Trento  1/5/15  26
Italy   Trentino    Trento  1/6/15  33
Italy   Trentino    Trento  1/7/15  27
", sep = "\t")

dput(trst,  control = "all")
structure(list(region_1 = structure(c(3L, 3L, 3L, 3L, 3L, 3L,
3L, 3L, 3L, 3L, 3L, 3L, 3L, 3L, 1L, 1L, 1L, 1L, 1L, 1L, 1L, 2L,
2L, 2L, 2L, 2L, 2L, 2L), .Label = c("Greece", "Italy", "USA"), class = "factor"),
region_2 = structure(c(1L, 1L, 1L, 1L, 1L, 1L, 1L, 3L, 3L,
3L, 3L, 3L, 3L, 3L, 2L, 2L, 2L, 2L, 2L, 2L, 2L, 4L, 4L, 4L,
4L, 4L, 4L, 4L), .Label = c("CA", "Macedonia", "PA", "Trentino"
), class = "factor"), region_3 = structure(c(2L, 2L, 2L,
2L, 2L, 2L, 2L, 1L, 1L, 1L, 1L, 1L, 1L, 1L, 3L, 3L, 3L, 3L,
3L, 3L, 3L, 4L, 4L, 4L, 4L, 4L, 4L, 4L), .Label = c("Pittsburg",
"San Francisco", "Skopje", "Trento"), class = "factor"),
date = structure(c(1L, 2L, 3L, 4L, 5L, 6L, 7L, 1L, 2L, 3L,
4L, 5L, 6L, 7L, 1L, 2L, 3L, 4L, 5L, 6L, 7L, 1L, 2L, 3L, 4L,
5L, 6L, 7L), .Label = c("1/1/15", "1/2/15", "1/3/15", "1/4/15",
"1/5/15", "1/6/15", "1/7/15"), class = "factor"), incidents = c(37L,
30L, 31L, 33L, 28L, 33L, 39L, 38L, 35L, 37L, 33L, 30L, 33L,
25L, 29L, 37L, 28L, 38L, 27L, 38L, 39L, 35L, 31L, 34L, 34L,
26L, 33L, 27L)), .Names = c("region_1", "region_2", "region_3",
"date", "incidents"), class = "data.frame", row.names = c(NA,
-28L))
Each group of region_1,region_2,region_3 has its own a seasonality and trend.
I am trying to forecast the number of incidents for the next one week based on the historic data. I have 6 months of historic data from January 01, 2015 to June 30,2015 for 32 different countries. And each country has many region_2 and region_3. I have a total of 32,356 unique region_1, region_2, region_3 time series.
I have 2 questions/issues:
- Issue - The issue that I am facing is when I apply Holt Winters in by() function, I am getting warnings and I am not able to understand them. Any help in understanding them is quite helpful
The following is my code:
ts_fun <- function(x){
  ts_y <- ts(x, frequency = 7)
}

hw_fun <- function(x){
    ts_y <- ts_fun(x)
    ts_h <- HoltWinters(ts_y)
}

combo_1_daily_mini$region_1 <- as.factor(combo_1_daily_mini$region_1)
combo_1_daily_mini$region_2 <- as.factor(combo_1_daily_mini$region_2)
combo_1_daily_mini$region_3 <- as.factor(combo_1_daily_mini$region_3)

combo_1_ts <- by(combo_1_daily_mini,list(combo_1_daily_mini$region_1,
                                     combo_1_daily_mini$region_2,
                                     combo_1_daily_mini$region_3
                                     ),ts_fun)

combo_1_hw <- by(combo_1_daily_mini,list(combo_1_daily_mini$region_1,
                                     combo_1_daily_mini$region_2,
                                     combo_1_daily_mini$region_3
                                     ),hw_fun)
Warning messages:
1: In HoltWinters(ts_y) :
 optimization difficulties: ERROR: ABNORMAL_TERMINATION_IN_LNSRCH
2: In HoltWinters(ts_y) :
 optimization difficulties: ERROR: ABNORMAL_TERMINATION_IN_LNSRCH
3: In HoltWinters(ts_y) :
 optimization difficulties: ERROR: ABNORMAL_TERMINATION_IN_LNSRCH
4: In HoltWinters(ts_y) :
 optimization difficulties: ERROR: ABNORMAL_TERMINATION_IN_LNSRCH
Question - Is the way I am applying the function by multiple columns correct? Is there a better way? I am essentially looking to get next week forecast numbers by region_1, region_2, region_3. For which I am planning to use the following code:
nw_forecast <- forecast(combo_1_hw,7)
I am able to apply Holt Winters function and also forecast when I create time series data by each region_1,region_2,region_3 combination. This method is not feasible as there are 32,356 unique combinations in my dataset.
Any help is appreciated Thanks


dput; I tried to read it by usingread.delim(pipe(“pbpaste”))withsepas tab or space but it proved cumbersome. – Nonflammableread.table(text=...)) code actually work on your computer? I tried it but, similar to Konrad, it is not working for me (line 8 did not have 6 elements). I second his suggestion to usedput, both in the first comment and in the subsequent link provided. (I'm not about to work hard to fix it: it's late, and the onus is on you.) – Unamericanncol(combo_1_daily_mini)is 1. – Unamerican