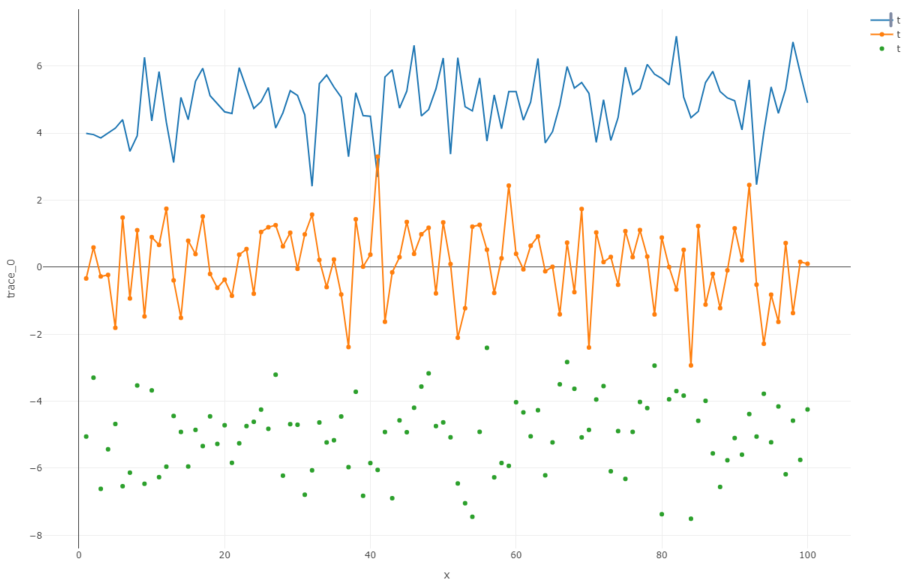
I am building a reveal.js-presentation. I have one graph, which I need to show upfront. However the graph is only generated later. Therefore I save it into as html. And load it using:
<style>
  .p_iframe iframe {
    width:90%;
    height:576px;
}
</style>

<div class="p_iframe">
<iframe frameborder="0" seamless='seamless' scrolling=no src="test.html"></iframe>
</div>
However this cuts off the legend if I open in Opera, Firefox or MS Edge. But if I use the iframe without div the graph doesn't come in the right size. How can I modify the css or the html such that the graph loads correctly? I need to open the presentation with a browser.
Update: The graph seems to work in Firefox and likely in Chrome too. Thanks to DJack for pointing it out. Is there any alternative code to make it work in other less used Browsers like MS Edge or Opera?
For the iframe-options I use this plotly help-page. There is an html version of how to embed plotly - but I do not understand how to modify it, such that I can load the plotly-html from local drive.
I generated the graph and the html using the following Rmd-Protocol:
---
title: "Untitled"
output: revealjs::revealjs_presentation
---

## Slide with R Code and Output
```{r}
library(plotly)

trace_0 <- rnorm(100, mean = 5)
trace_1 <- rnorm(100, mean = 0)
trace_2 <- rnorm(100, mean = -5)
x <- c(1:100)

data <- data.frame(x, trace_0, trace_1, trace_2)

p <- plot_ly(data, x = ~x, y = ~trace_0, name = 'trace 0', type = 'scatter', mode = 'lines') %>%
  add_trace(y = ~trace_1, name = 'trace 1', mode = 'lines+markers') %>%
  add_trace(y = ~trace_2, name = 'trace 2', mode = 'markers')

htmlwidgets::saveWidget(p,'test.html')
```

<style>
  .p_iframe iframe {
    width:90%;
    height:576px;
}
</style>

<div class="p_iframe">
<iframe frameborder="0" seamless='seamless' scrolling=no src="test.html"></iframe>
</div>

