Hard issue happening in production for a long time, we have no clue about where it's coming from. Can sometimes reproduces it on localhost, Heroku Enterprise support has been clue-less about this.
On our production database, we currently have the following setup:
- Passenger Standalone, threading disabled, limited to 25 processes MAX. No min setup.
- 3 web dynos
a SELECT * FROM pg_stat_activity GROUP BY client_addr and count the number of connections per instance shows that more than 1 PSQL connection is opened for one passenger process during our peak days.
Assumptions:
- A single address is about a single Dyno (Confirmed by Heroku staff)
- Passenger does not spawn more than 25 processes at the time (confirmed with
passenger-statusduring those peaks)
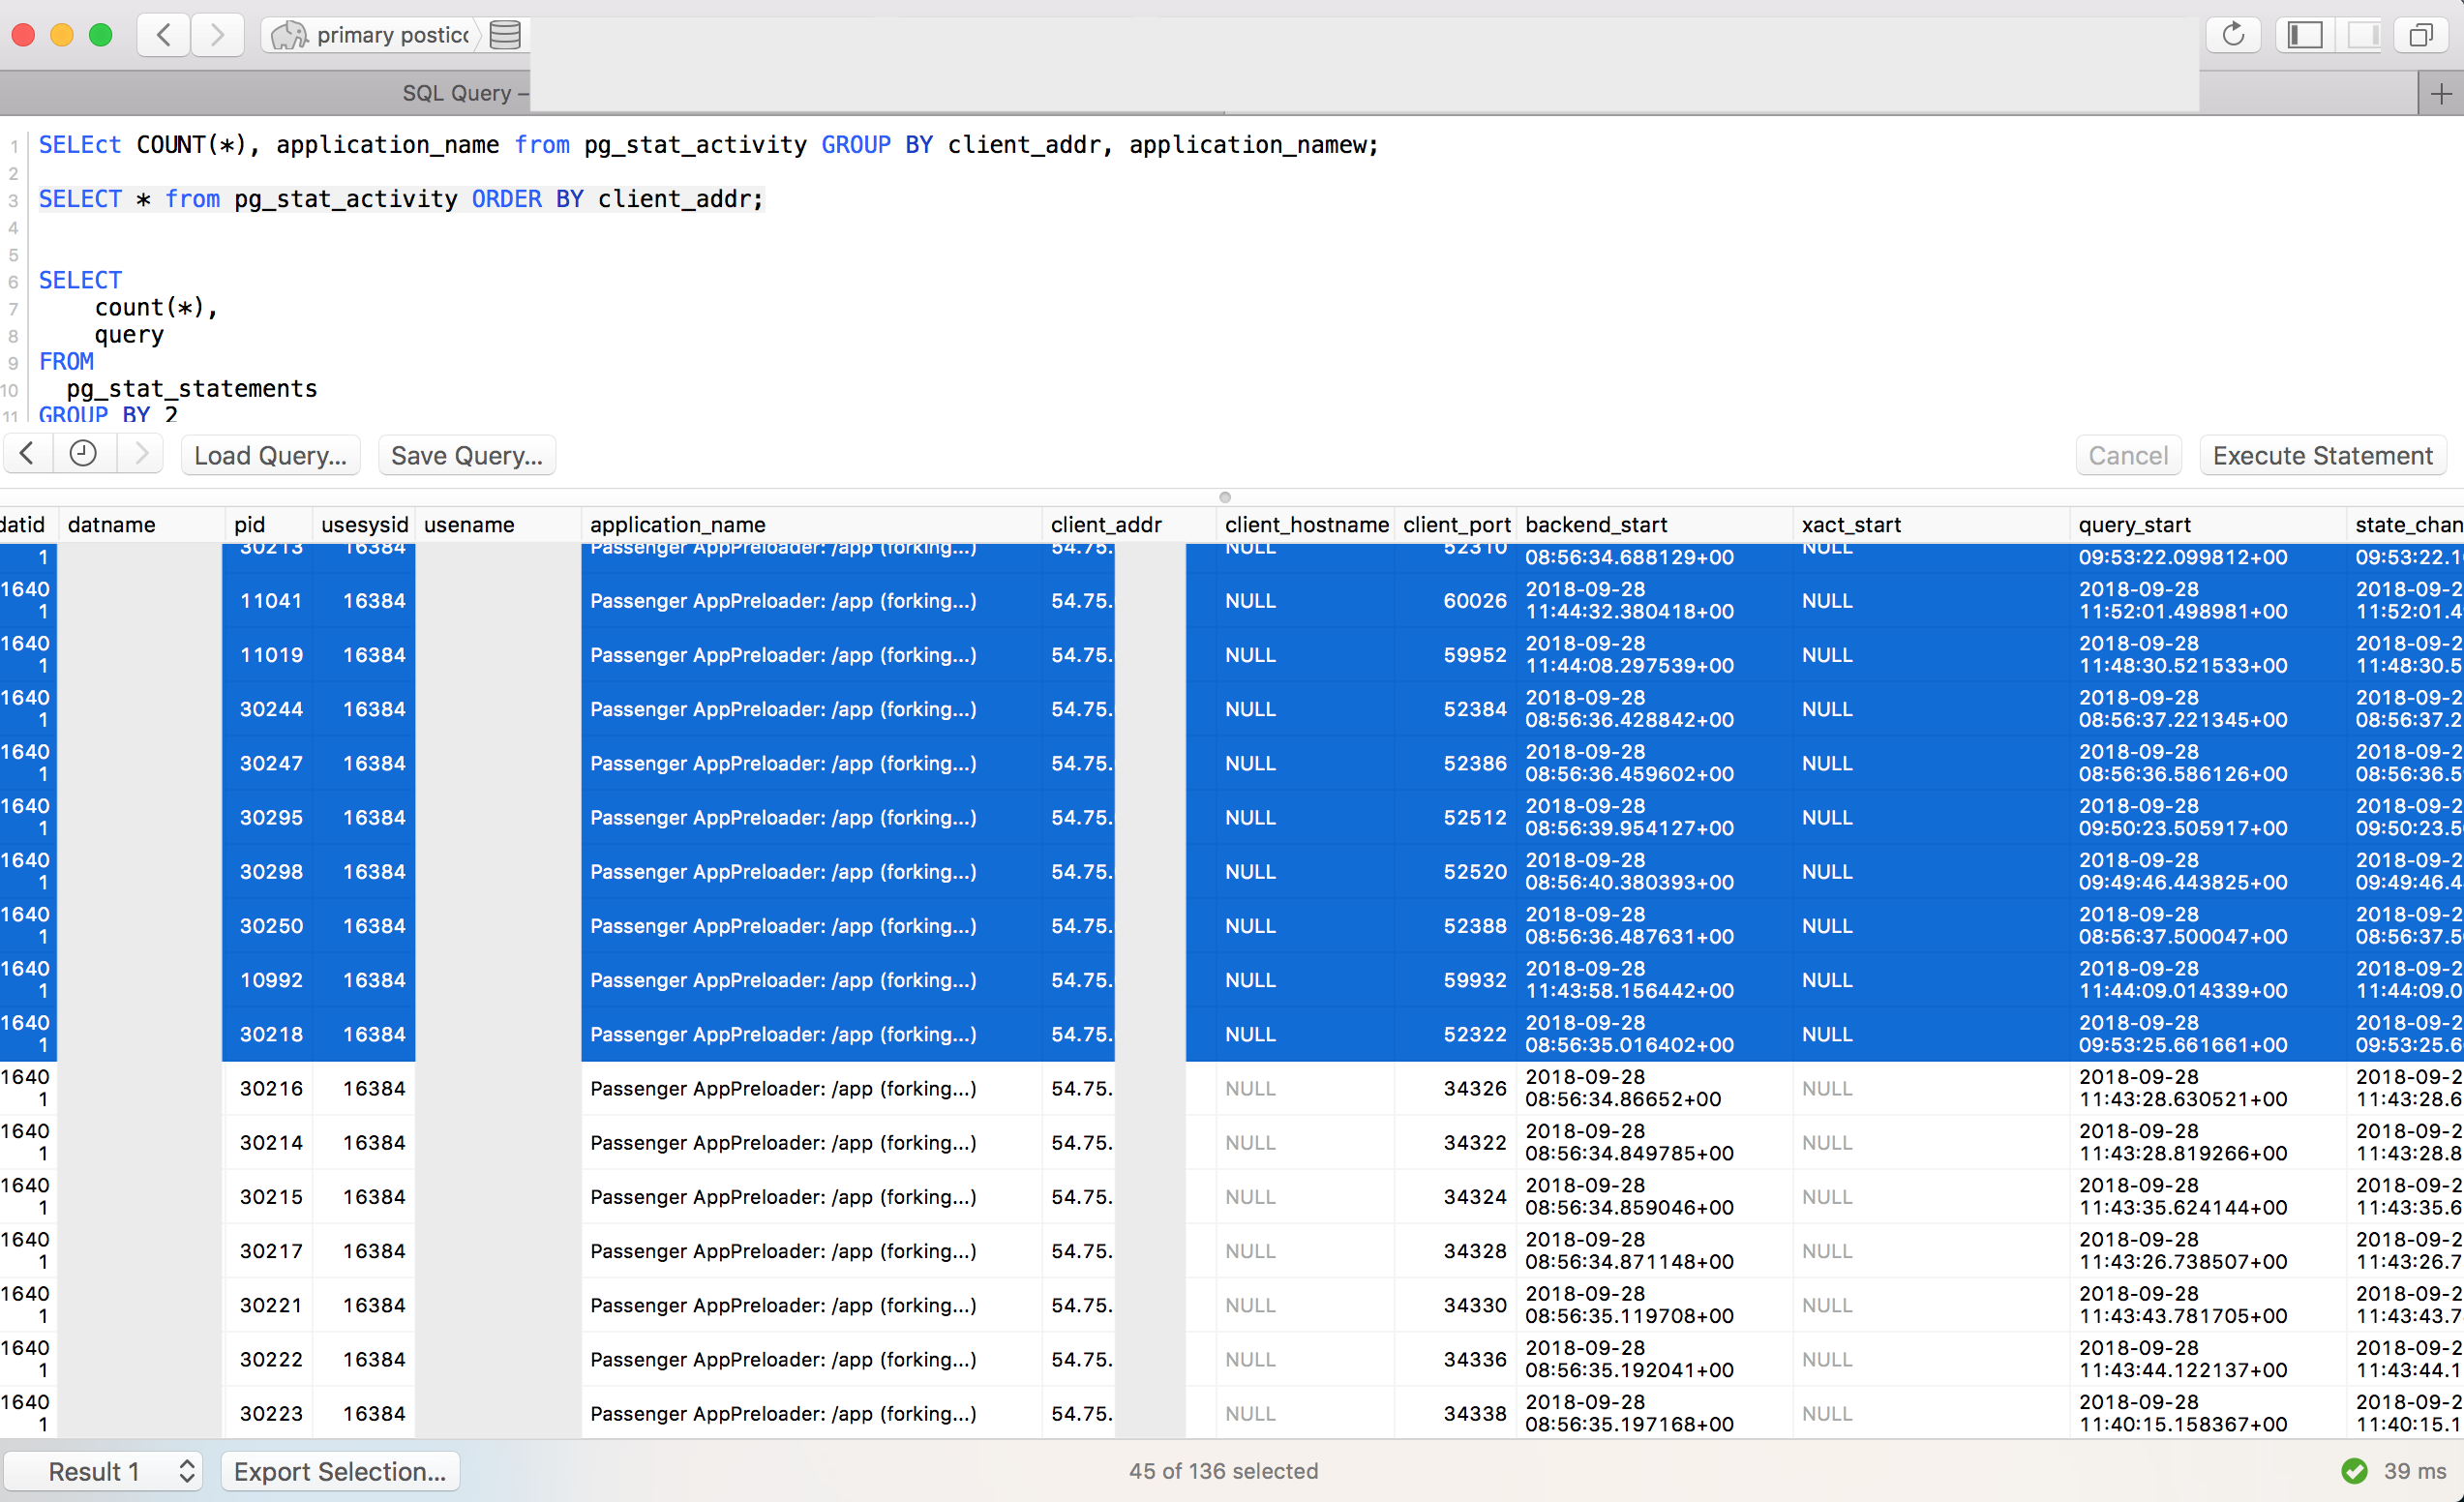
Here is a screenshot of what looks the SELECT * FROM pg_stat_activity;:
 In the screenshot, we can see that there are 45 psql connections coming from the same dyno that runs passenger. If we followed our previous logic, it should not have more than 1 connection per Passenger process, so 25.
The logs doesn't look unusual, nothing mentioning either a dyno crash / process crash.
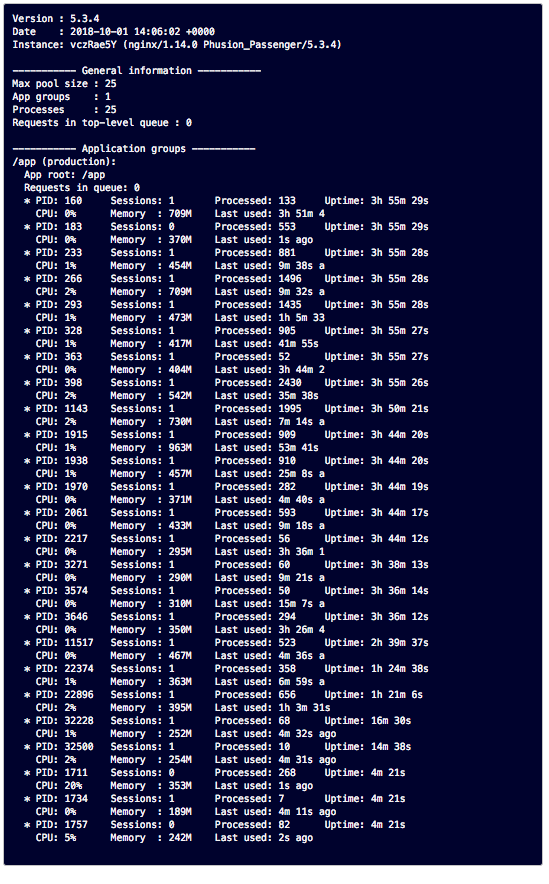
Here is a screenshot of our passenger status for the same dyno (different time, just to prove that there are not more processes than 25 created for one dyno):

And finally one of the response we got from the Heroku support (Amazing support btw)
I have also seen previous reports of Passenger utilising more connections than expected, but most were closed due to difficulty reproducing, unfortunately.
In the Passenger documentation, it's explained that Passenger handle itself the ActiveRecord connections.
Any leads appreciated. Thanks!
Various information:
- Ruby Version:
2.4.x - Rails Version:
5.1.x - Passenger Version:
5.3.x - PG Version:
10.x - ActiveRecord Version:
5.1.x
If you need any more info, just let me know in the comments, I will happily update this post.
One last thing: We use ActionCable. I've read somewhere that passenger is handling weirdly the socket connections (Opens a somewhat hidden process to keep the connection alive). This is one of our leads, but so far no luck in reproducing it on localhost. If anyone can confirm how Passenger handles ActionCable connections, it would be much appreciated.
Update 1 (01/10/2018):
Experimented:
- Disable NewRelic Auto-Explain feature as explained here: https://devcenter.heroku.com/articles/forked-pg-connections#disabling-new-relic-explain
- Run locally a Passenger server with min and max pool size set to 3 (more makes my computer burn), then kill process with various signals (SIGKILL, SIGTERM) to try to see if connections are closed properly. They are.
