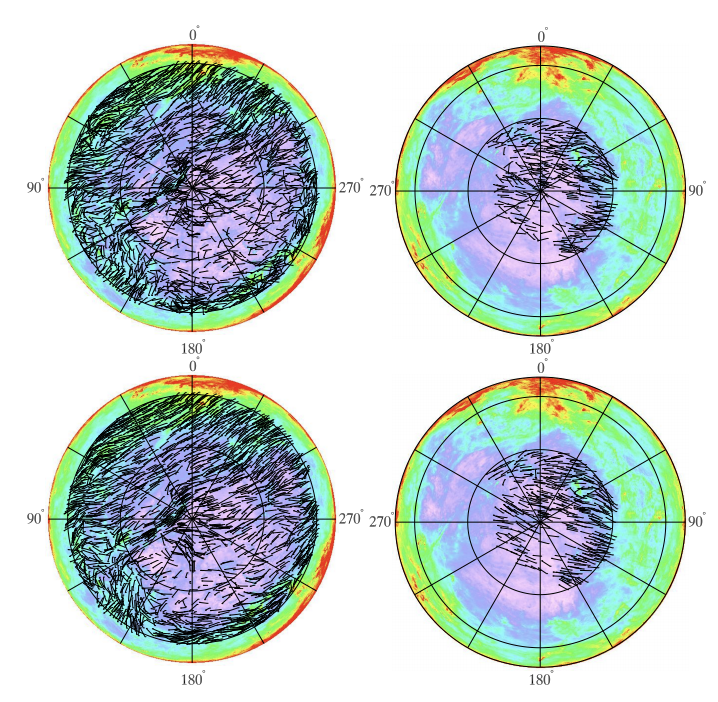
I'd like to know the simplest way to plot vectors or oriented line segments on a healpy map, e.g. Fig 22 of this paper: https://arxiv.org/abs/1807.06212, screenshotted below. Is something like matplotlib's quiver available to plot on e.g. orthographic or mollweide projections in healpy?
© 2022 - 2024 — McMap. All rights reserved.

