I have a very strange issue seemingly caused by compiling with latest Xcode 10.2.
I have noticed my app start time to get significantly worse (3x slower) caused simply by building using Xcode 10.2(.x) and running on iOS 12.2. The same code revision, when running on older iOS (12.0) or compiled with Xcode 10.1 for iOS 12.2, runs fine.
The delay happens even before main() gets called. Basically the delay between console saying Bootstrapping com.myapp.something with intent foreground-interactive and main() is called is where the measured time start increase happens.
App setup (quickly):
- Mixed target Swift + Obj-C
- Using internal frameworks for code separation
- Using CocoaPods (1.5.3) with frameworks
- ~35 internal frameworks loaded in runtime (internal + mostly CocoaPods)
Here is what happens
Old code revision (Swift 4.2) - one of older releases which worked fine back then compiled using Xcode 10.1
This is the table showing impact of compiling with Xcode 10.2 to app launch times (the moment first frame of status bar fade in starts).
|            | iOS 12.0 | iOS 12.2 |
|------------|----------|----------|
| Xcode 10.1 |       1x |    1.25x |
| Xcode 10.2 |       1x |       3x | <-- 💥
The startup time of last OK release (iOS 12.0 / Xcode 10.1) is considered 1x, the rest is relative to it. We are talking seconds here (less the 3s -> almost 9s).
This significant delay happens only on fresh install. Every subsequent launch is fast again.
Latest code (Swift 5) - all code migrated to Swift 5, all CocoaPods updated to latest Swift 5 compatible versions, project updated to Xcode 10.2 settings
Very similar situation as before Swift 5. So Swift 5 itself does not seem to be the issue.
Edit 1:
Time Profiler uncovered that Initialization time got drastically slower.
Turns out _dyld_start (loading of dynamic frameworks) is ~35x slower.
|            | _dyld_start time |
|------------|------------------|
| Xcode 10.1 |             0.2s |
| Xcode 10.2 |             7.0s |
This means something related to Xcode 10.2 + iOS 12.2 causes loading of dynamic frameworks to get drastically slower.
With my ~35 dynamic frameworks loaded to runtime (most of it CocoaPods), the perf degradation seems to be massive. No clue why the change though...
Since the issue happens only on iOS 12.2 + Xcode 10.2 (which has support for Swift 5), I was wondering if this issue can somehow be related to ABI stability or something. What does not make sense to me is that it happens even for code before Swift 5 migration when compiled with Xcode 10.2.
What I have tried so far:
- Updating to latest CocoaPods 1.7.0.rc.2 - no impact
- Measuring with Time Profiler
Edit 2:
Seems to be caused by dynamic linker. We have made some investigation and linked seems to be using different implementation on iOS 12.2 when loading frameworks.
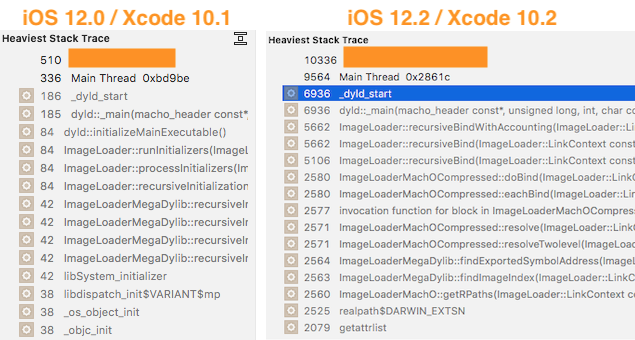
Since iOS 12.2 there is a lot of mentions of "recursive" in Instruments when loading (in ImageLoader::) and seems like the recursion goes wrong there. The stack trace seems to go very wrong (see screenshots below).
I guess the only workaround here would be to remove frameworks and compile directly or using static libraries.
Any help / ideas on how to keep using frameworks appreciated! Thank you!
Edit 3:
The issue does not seem to happen anymore on first iOS 13 Public beta.
Measurements (setup below) showed me that launching same code revision on iOS 12.3.1 takes about 3x longer then on iOS 13.
This really seems to me as bug on iOS 12.x. Given fact iOS 13 is out quite soon, I don't think any fix will appear for iOS 12.x anymore (leaving dropped devices like iPhone 6 to suffer...).
Test setup:
- Running the very same code (Swift 5, Xcode 11 beta 2)
- Running on the same iPhone model (iPhone 6S 16GB)
- Cold app launch after device reboot
- Devices with iOS 12.3.1 (latest stable) and iOS 13 (first Public Beta)

