for me, you need firstly attach the remote FF debugger https://marketplace.visualstudio.com/items?itemName=firefox-devtools.vscode-firefox-debug
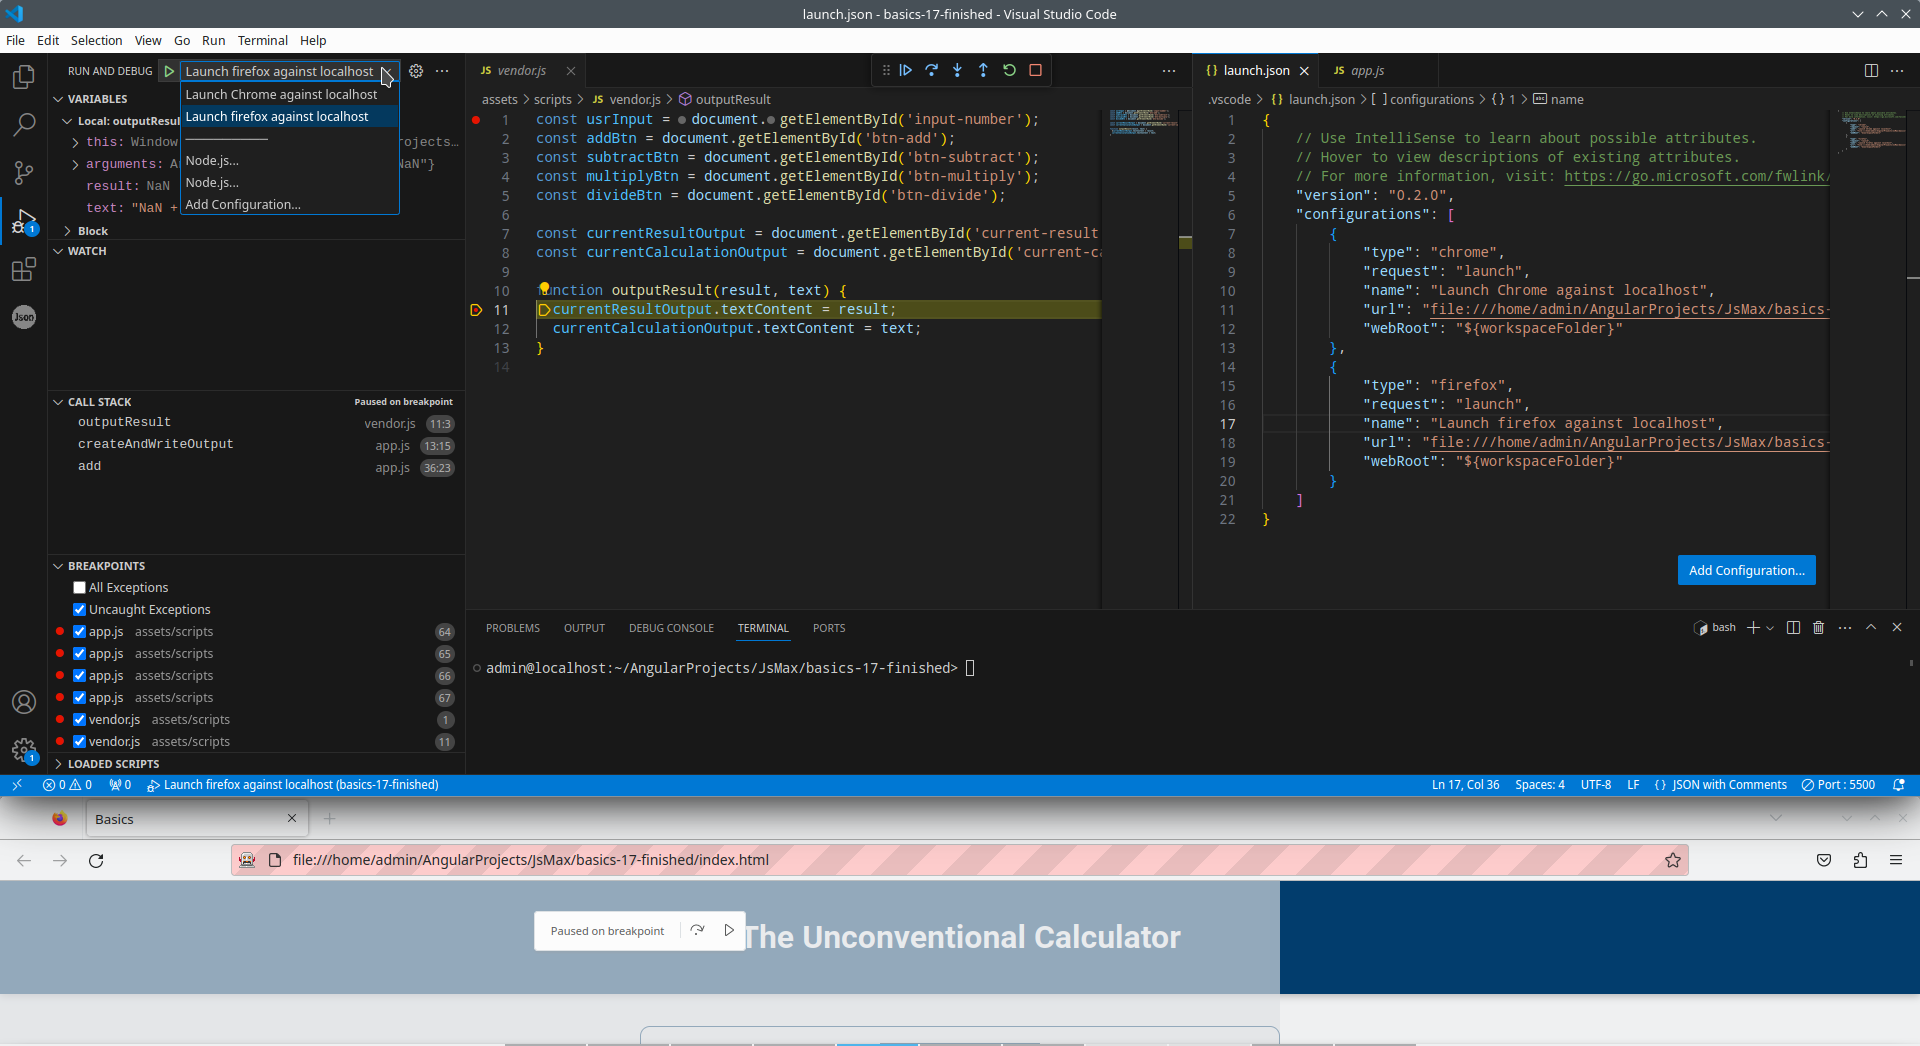
if it attached correctly, you will see red background on URL fields
than you need to prepare very simple config, for example in my case
  [...,
    {
        "type": "firefox",
        "request": "launch",
        "name": "Launch firefox against localhost",
        "url": "file:///home/admin/AngularProjects/JsMax/finished/index.html",
        "webRoot": "${workspaceFolder}"
    }
also there are two main case for start JS with .html page - one of them is "open on live server" https://github.com/ritwickdey/vscode-live-server-plus-plus and second case "open in default browser" https://marketplace.visualstudio.com/items?itemName=peakchen90.open-html-in-browser - in first case we use context menu on main editor windows, in second case on project three. First case working perfectly with Node.js, second case for vanilla JS.
In this case I use debugger with vanilla Javascript, so I click open on default browser, I see red background on URL (that mean FF controlled remotely) and you can enjoy to use debugger on VS code (what connected remotely to FF)
![Firefox remote debugging]()
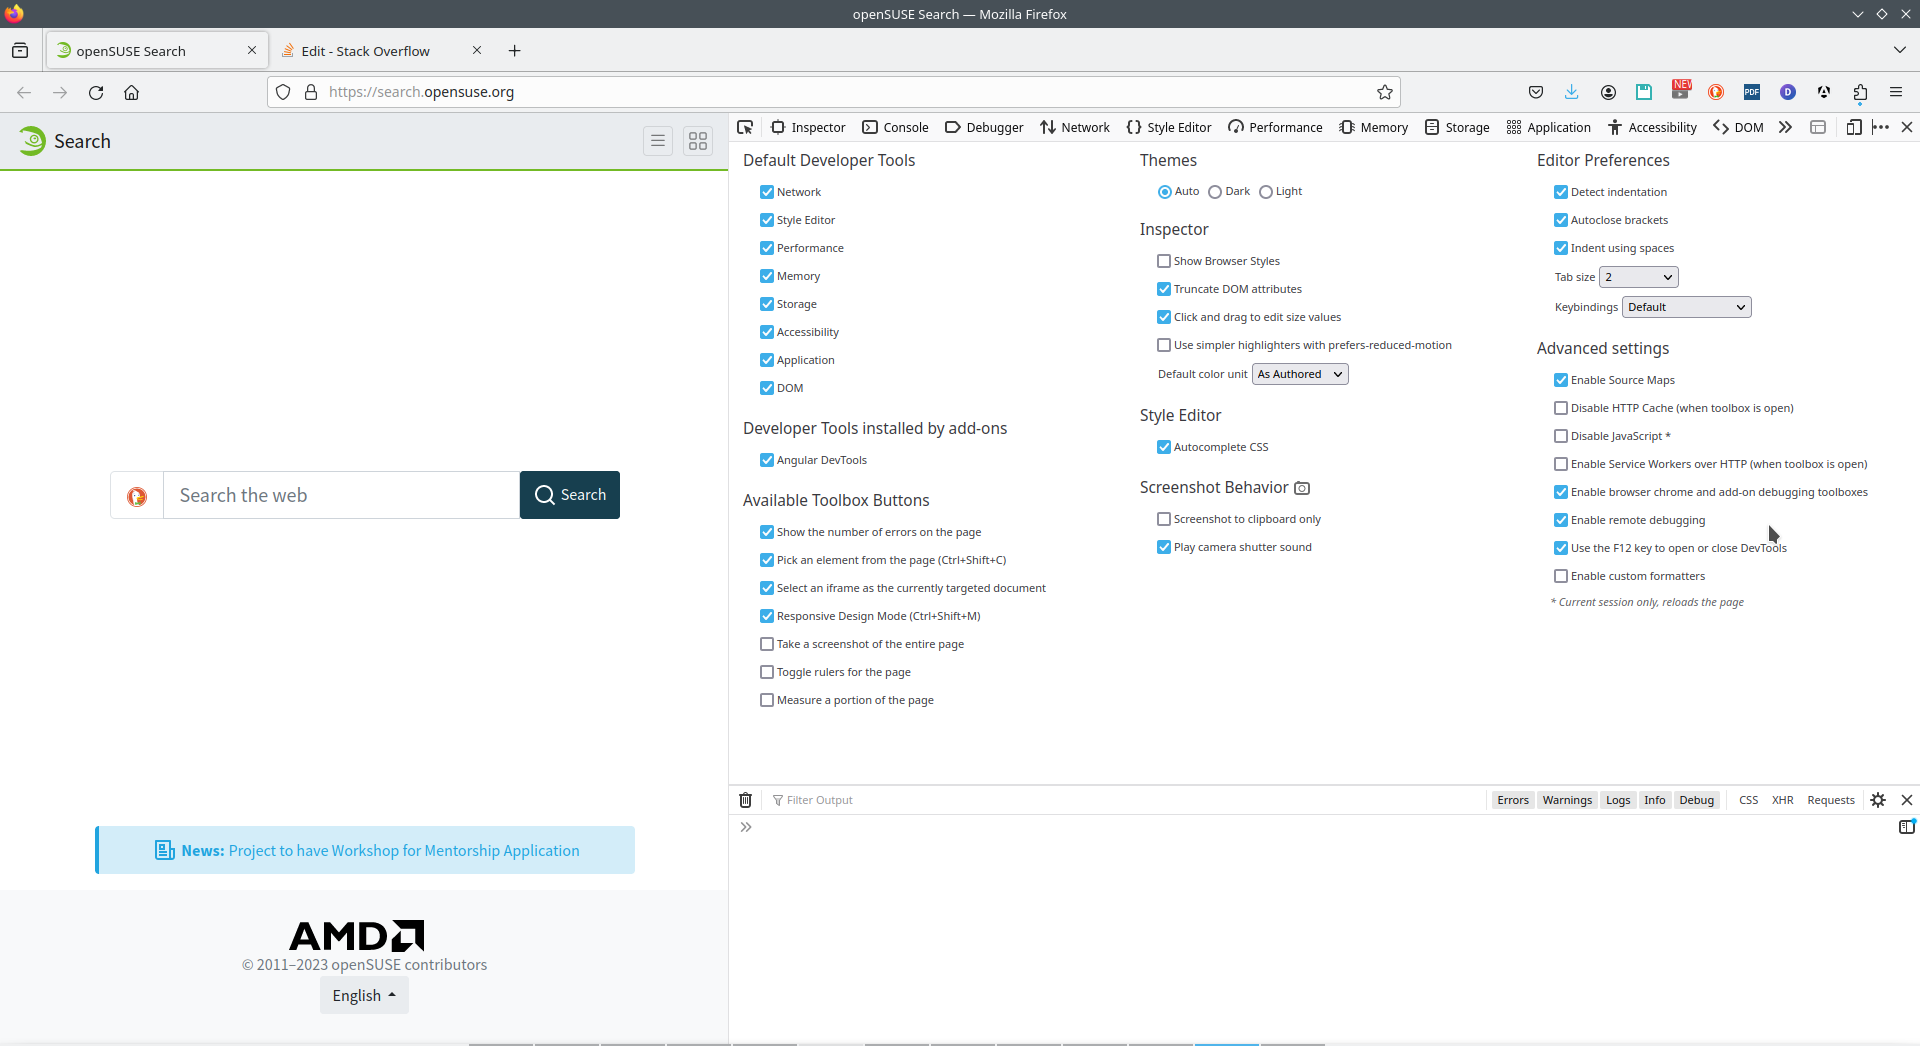
also there are two variables, you can set up it on about:config
 devtools.debugger.remote-enabled   true
 devtools.chrome.enabled    true
or the same variables you can see on Firefox dev tools on setting tab (on the bottom of right column)
![Firefox tuning for remote debugger]()
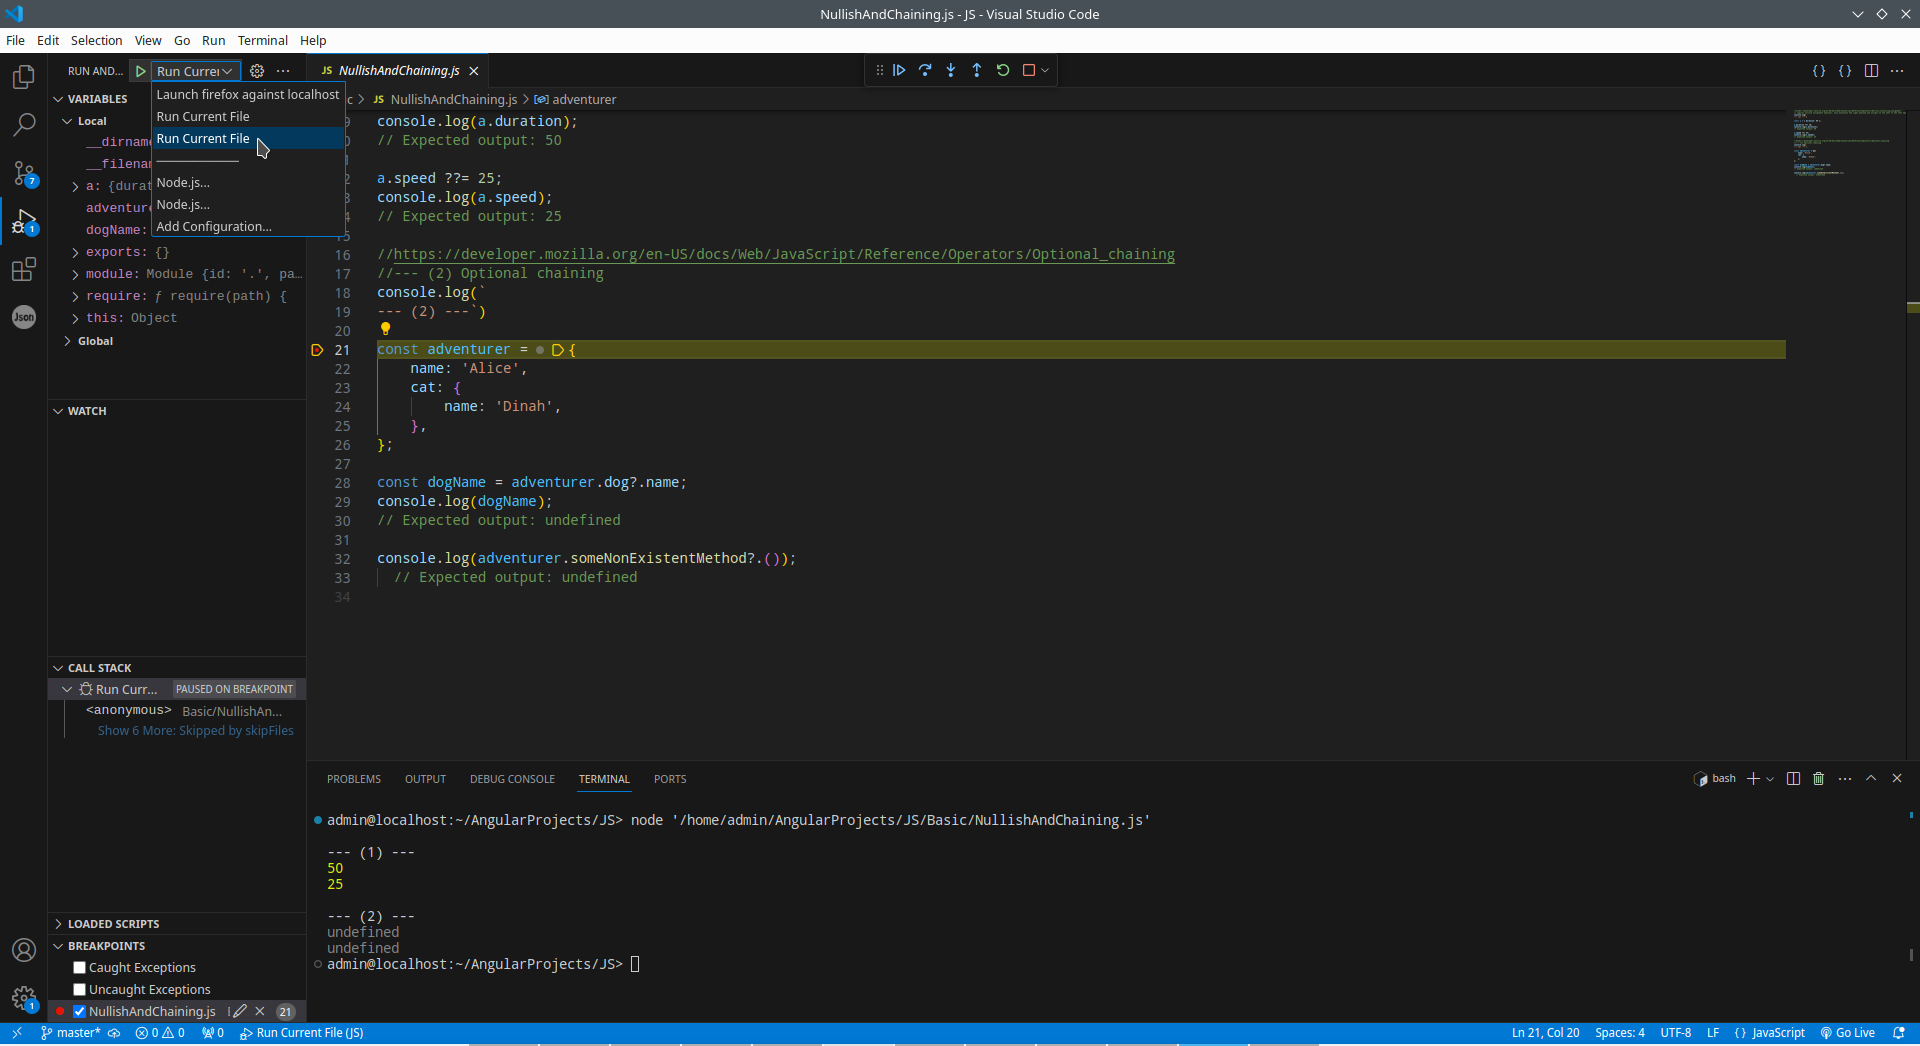
And, pay attention, if you want to debug JS only functions (without FF) you need of course absolutely another config (and installed Node.js), for example in my case
    {
        "type": "node",
        "name": "Run Current File",
        "request": "launch",
        "program": "${workspaceFolder}/Basic/NullishAndChaining.js"
    }
![Debug functions with Node.js]()


