How to rotate multicategory x-axis tick labels in plotly?
Asked Answered
L

1

6

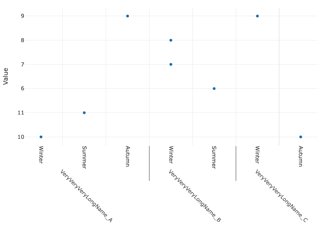
I'm building a r / plotly chart with multicategory x-axis. I found a way to define two x-axis categories with rbind(), but can't seem to find a way to rotate x-axis tick labels for both categories (tickangle property only affects first category, but not the second one).

Tried to google answer (of course) but couldn't find much help.

I found this discussion - they're mentioning label rotation with multicategory plot as one issue to be solved, but there's no conclusion how this is achieved in reality. https://github.com/plotly/plotly.js/issues/2799

library(plotly)

df <- data.frame(
    name1 = c('Winter', 'Summer', 'Autumn', 'Winter', 'Winter', 'Summer', 
        'Winter', 'Autumn'),
    name2 = c('VeryVeryVeryLongName_A', 
        'VeryVeryVeryLongName_A', 
        'VeryVeryVeryLongName_A', 
        'VeryVeryVeryLongName_B', 
        'VeryVeryVeryLongName_B',
        'VeryVeryVeryLongName_B', 
        'VeryVeryVeryLongName_C',
        'VeryVeryVeryLongName_C'),
    Value = c('10', '11', '9', '8', '7', '6', '9', '10')
                 )

plot_ly(df) %>%
  add_trace(x = rbind(c(~name2, ~name1)), y = ~Value, type = 'scatter', mode = 'markers') %>%
  layout(xaxis = list(tickangle = 90)) #this only affects the 1st category (name1), but not the 2nd (name2). 

I would like to find a way to define tickangle property for both categories independently (name1 and name2), or alternatively find a way to prevent overlapping 2nd category labels (long names).

Any help is greatly appreciated. Thanks =)

Lilywhite answered 27/9, 2019 at 13:23 Comment(0)
H
0

The functionality for modifying what Plotly calls _tickAngle(xtick =..., xtick2 = ...) is internally set. At this time, there's no external method to change the angles of xtick2(that I can find).

I did come up with a work around using the package htmlwidgets. This modifies the plot after you render, changing the angle of that second row of the multi-category x-axis.

The only manual change you have to make to your plot making space at the bottom by setting the bottom margin.

The last line of the code is

 }", data.frame(ang = 30)) # change to whatever angle you want

This makes changing the text angles pretty easy. Change that 30 to whatever angle you want.

I've used comments in the code to explain what's happening. However, if you have any questions, let me know.

plot_ly(df) %>%
  add_trace(x = rbind(c(~name2, ~name1)), y = ~Value, type = 'scatter', mode = 'markers') %>%
  layout(xaxis = list(tickangle = 90), margin = list(b = 150)) %>%   #<<---- I'm new!!
  htmlwidgets::onRender(
    "function(el, x, data) {
      fixMePlease = function() {
        xt2 = document.getElementsByClassName('xtick2');              /* collect elems */
        [...xt2].forEach( (e, i) => {                                 /* for each text elem */
          descent = Math.abs(data[0].ang/90/2);                       /* space for new text position */
          w = e.children[0].getBoundingClientRect().width;            /* y change needed */
          x = Number(e.children[0].getAttribute('x'));                /* rotation x */
          y = Number(e.children[0].getAttribute('y')) + descent * w;  /* get old & calc new y */
          trs = e.children[0].getAttribute('transform');              /* original transform to mod */
          repl = ' rotate(' + data[0].ang + ',' + x + ',' + y + ')';  /* assemble transform update */
          e.children[0].setAttribute('y', y);                         /* apply y change */
          e.children[0].setAttribute('transform', trs + repl);        /* apply rotation change */
        });
      }
      el.on('plotly_afterplot', function() {     /* update placement when restyling or replotting */
        fixMePlease();
      })
    }", data.frame(ang = 30)) # change to whatever angle you want (degrees, not radians!)

Here's what this looks like at 30, 45, and 60 degrees (with a bottom margin of 150, 180 and 210, respectively).

30 degree 45 degree

60 degree

Highwayman answered 28/9 at 23:25 Comment(0)

© 2022 - 2024 — McMap. All rights reserved.