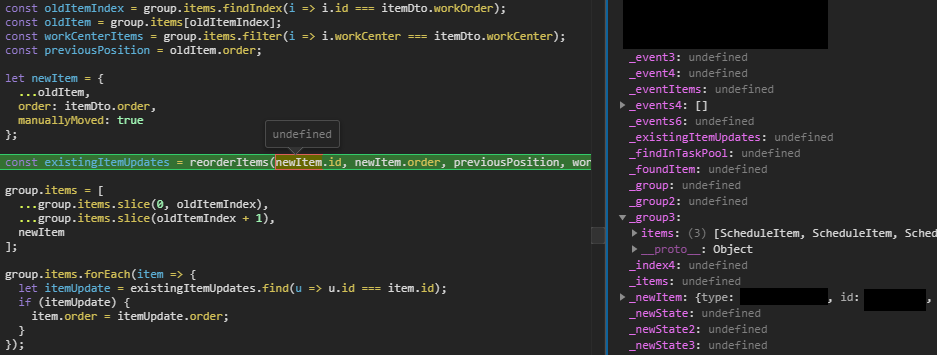
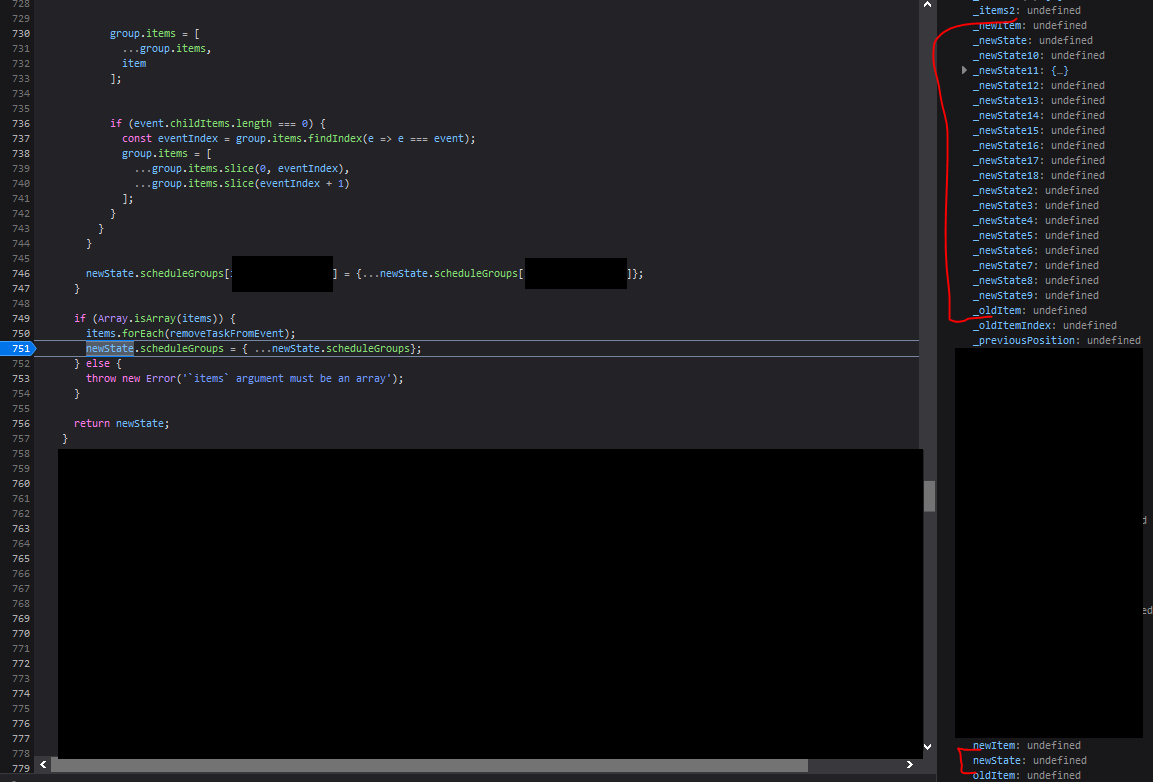
When using the Chrome or Firefox developer tools, I cannot peer into the values of certain reducer variables. For example, the newItem in the Chrome debugger screenshot below:
The code runs fine. Log statements output correctly, but inspecting via the debugger just shows undefined. However, if I look in the Scope view, I can see a variable called _newItem that has all the correct properties and values (obscured because they are potentially sensitive).
What seems to cause this issue is when I do a shallow clone of the state: let newState = {...state}; (either with spread syntax or Object.assign({}, state).
Every subsequent variable based on newState shows undefined but has a corresponding _variableName[0-9]* on the dev tools Scope view.
This does not happen in our React components, or other non-Reducer code.
It seems it could be some issue with Redux, source maps and the developer tools, but I cannot find anything searching either the Redux documentation or issue tracker, nor the Chrome bug tracker.
Redux: 4.0.5
OS: Windows 10 x64
Tested on:
Chrome: 81.0.4044.122, Canary: 84.0.4125.0
Firefox: 75.0, Dev. Edition: 76.0b4 (64-bit)
Note: This is not the same as this issue that deals with just Chrome's optimizations of closure variables.


group.items = [? Sometimes Chrome doesn't map variables properly in certain scopes. Also in the debugger the variable_newItemis prefixed with_, whereas in your source it has no_so it's not the same variable right? – Kernan_are the same. It's just that there can be many such variables. See the ones with the_groupprefix._group3has the correct values that should be shown forgroupin the source view. It always seems to be the last one, the others seem to always be undefined. It's like there's a source-map issue but it's an ejectedcreate-react-appwith no build modifications. – Masteratarms_prefix in one of the scope panes too? Also, are you able to view the value by typing it into the Chrome console? And finally, does this issue show up using Firefox dev tools aswell? – Kernanundefined. It happens with both the Chrome and Firefox dev tools. I updated the question with a FF screenshot. – Masteratarms