How to place the strip in facet_grid on top of plots when plotting graphs vertically stacked - similar to position.strip = "top" in facet_wrap?
Asked Answered
P

4

6

Using facet_grid(), how can I place the group names, i.e. the grey strips, on the top of the plots when graphing the plots stacked vertically in a single column?

From what I have tried, when stacking the plots vertically, using facet_grid(), you cannot place the strip on the top or bottom of the graph; you can only place the strip on the right hand side or the left hand side of the plots using the switch = c("y", "x", "both") argument.

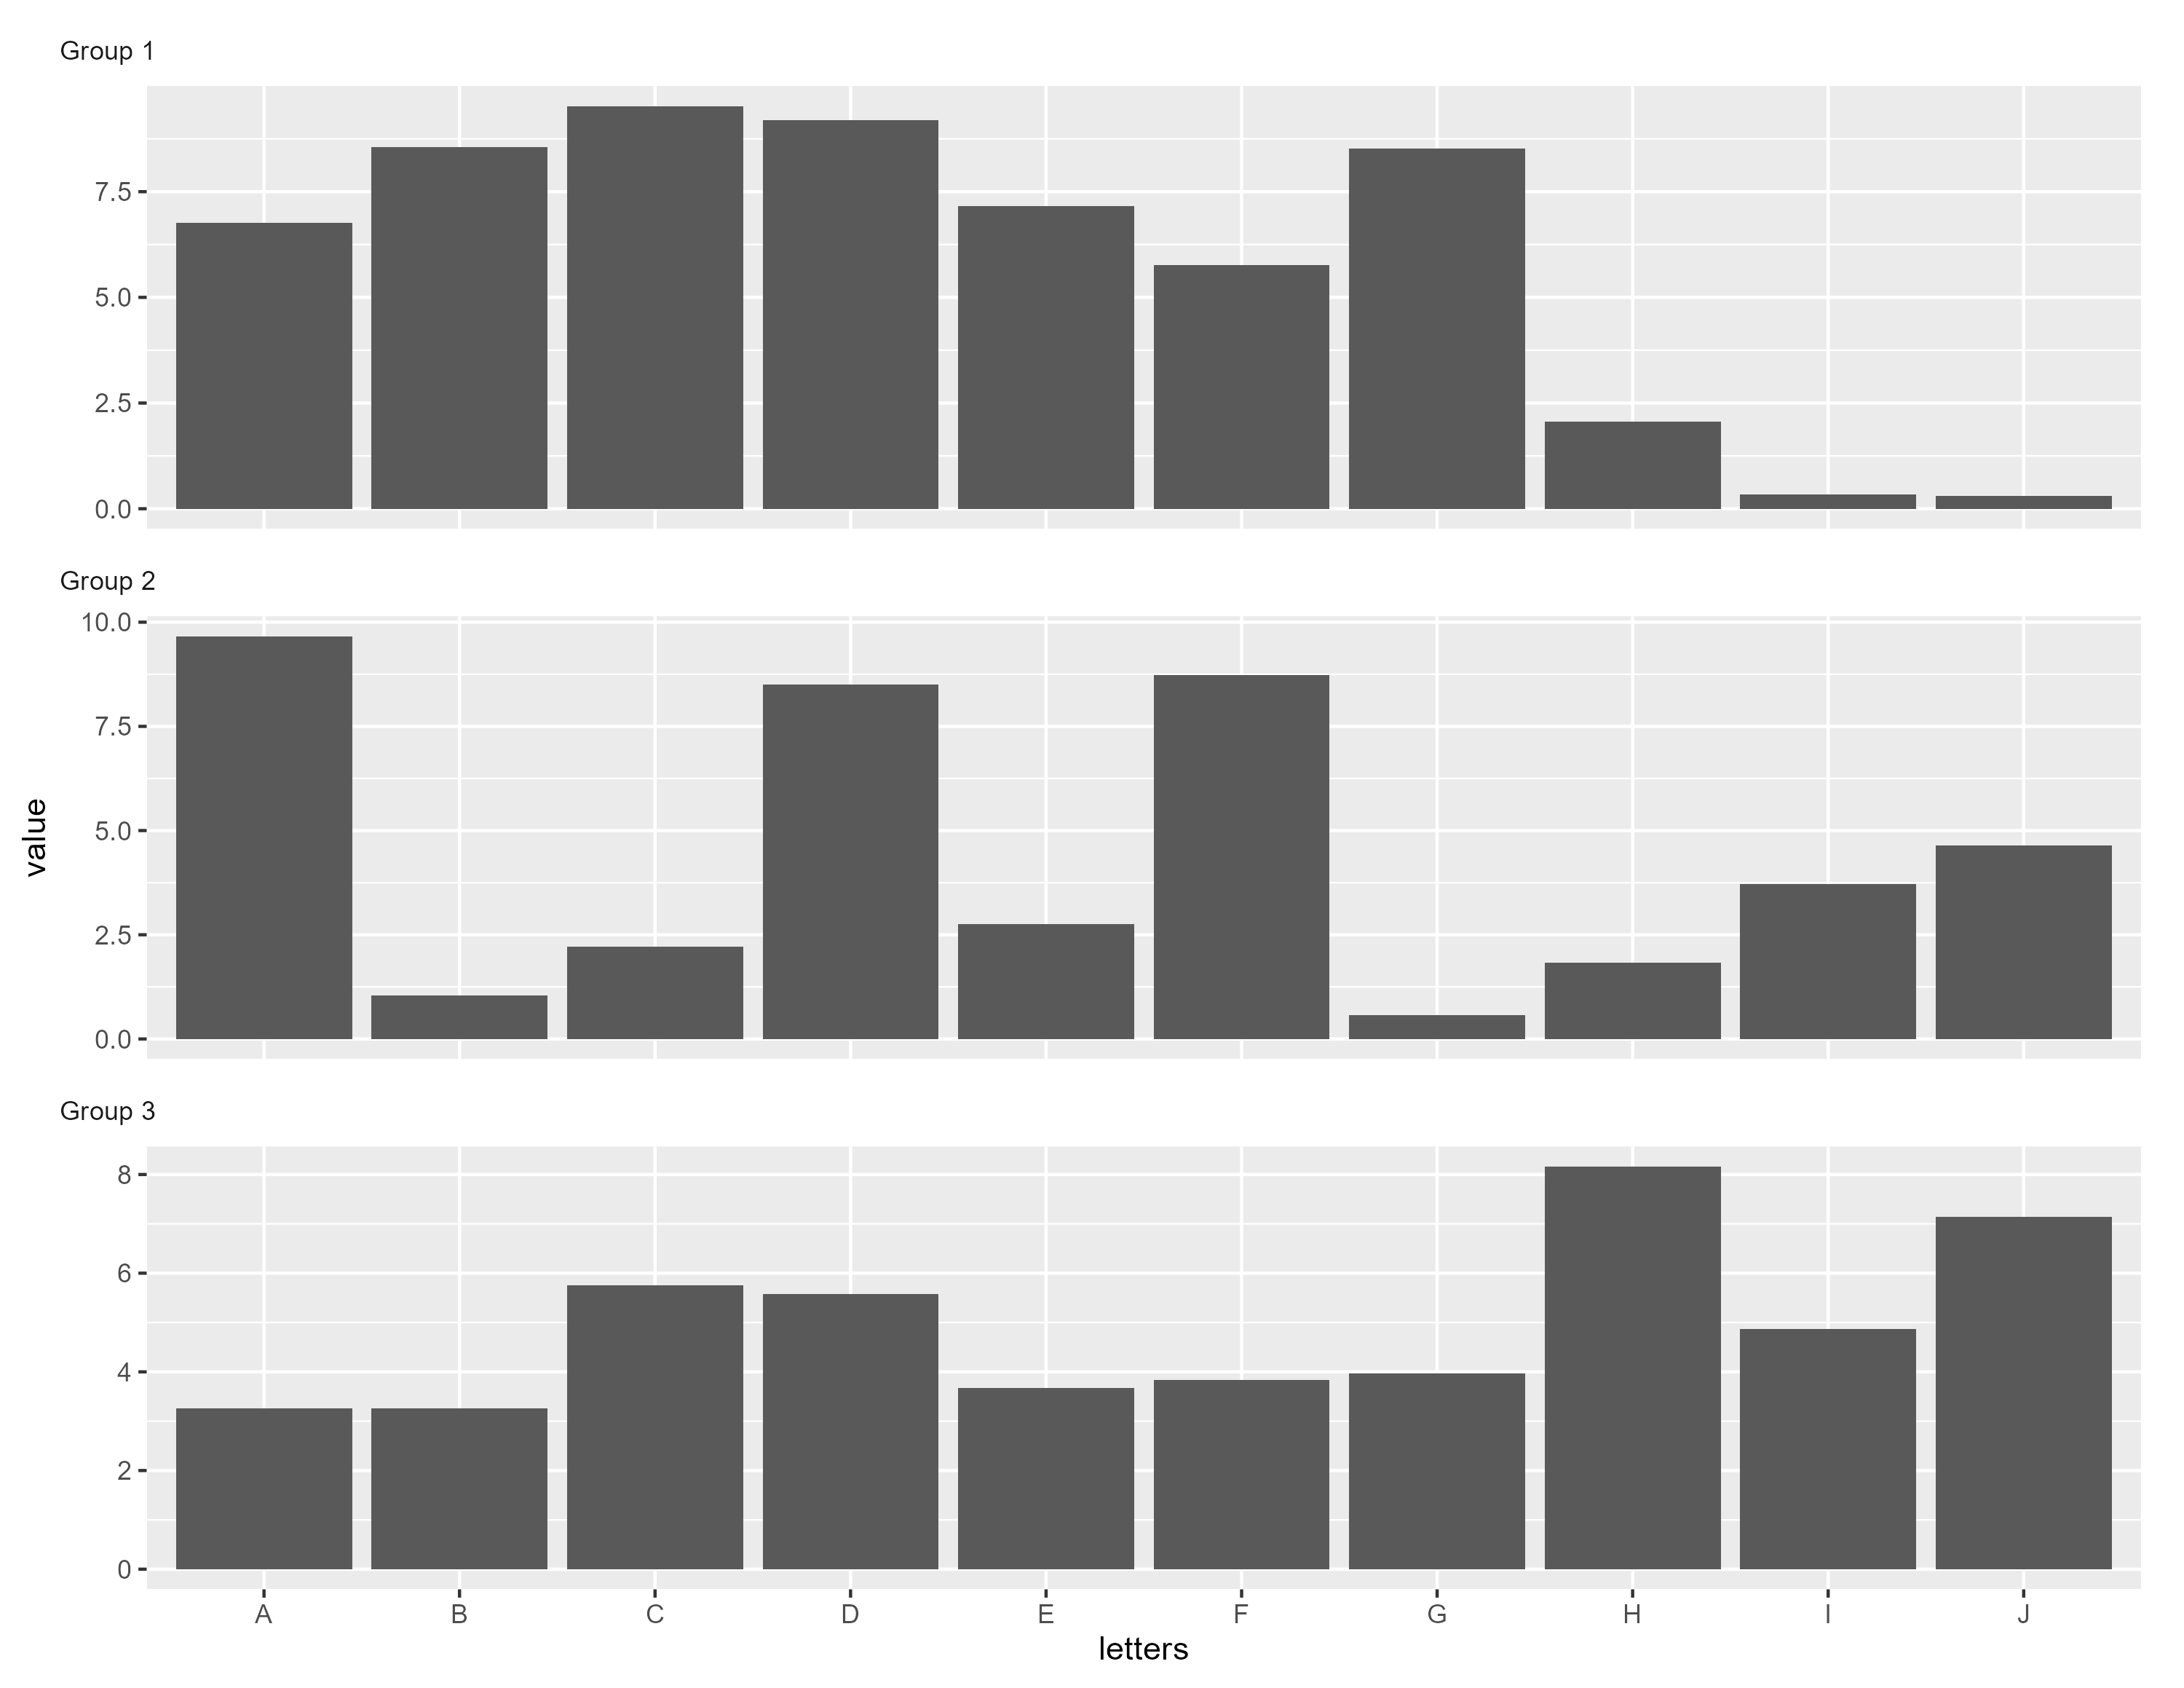
I am aware that facet_wrap() (and facet_col() from ggforce) can place the strip anywhere using the strip.position = c("top", "bottom", "left", "right") argument, irrespective of how the graphs are being plotted: vertically or horizontally. I used facet_wrap() to produce Fig.1 below (code is in the Reproducible Code section).

However, I would like to be able to produce the plot below (with the strip on "top") using facet_grid() not facet_wrap.

Fig.1: I want to be able to plot this using facet_grid()

Fig.1

Ideally, it would be great if the switch argument could be extended or the strip.position argument could be added to facet_grid(), to be able to place the strip on top. I tried to do it myself by trying to change the source code from facet_grid() and facet_wrap() functions, but could not figure it out.

The reason I am not simply using facet_wrap() function is because it unfortunately does not have the space="free" argument which is available in facet_grid() and is essential in my application.

Below is a reproducible example taken from, with slight modifications, the code of Brandon Bertelsen answer's here:

Reproducible Code:

The Data:

dat <- data.frame(value=runif(30)*10,
                  grouping=c(rep("Group 1",10),
                             rep("Group 2",10),
                             rep("Group 3",10)),
                  letters=rep(LETTERS[1:10], 3)

Using facet_wrap to get strip on top when plotting graphs vertically:

ggplot(dat, aes(letters,value, label = letters)) + 
  geom_bar(stat="identity") + 
  facet_wrap(grouping~., dir = "v")

Produces Fig.1:

Fig.1:

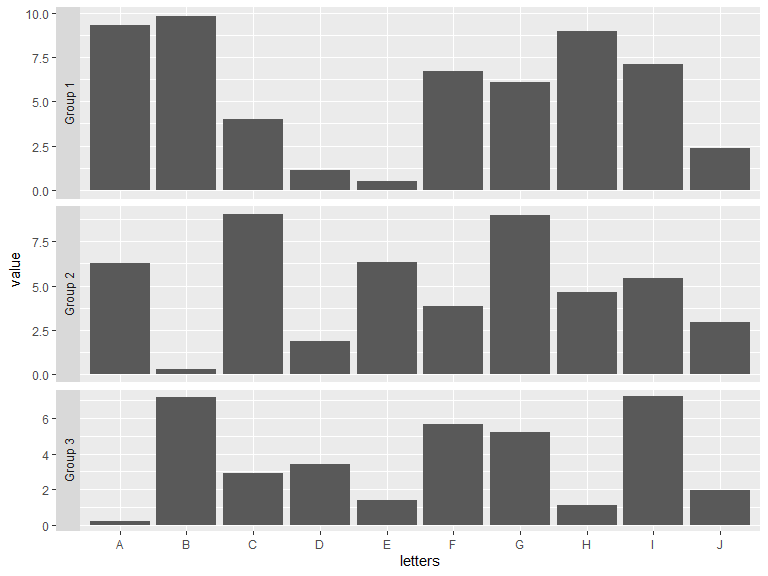
Using facet_grid with the switch = "y" places the strip to the left hand side:

ggplot(dat, aes(letters,value, label = letters)) + 
  geom_bar(stat="identity") + 
  facet_grid(grouping~., switch = "y")

Produces Fig.2:

Fig.2

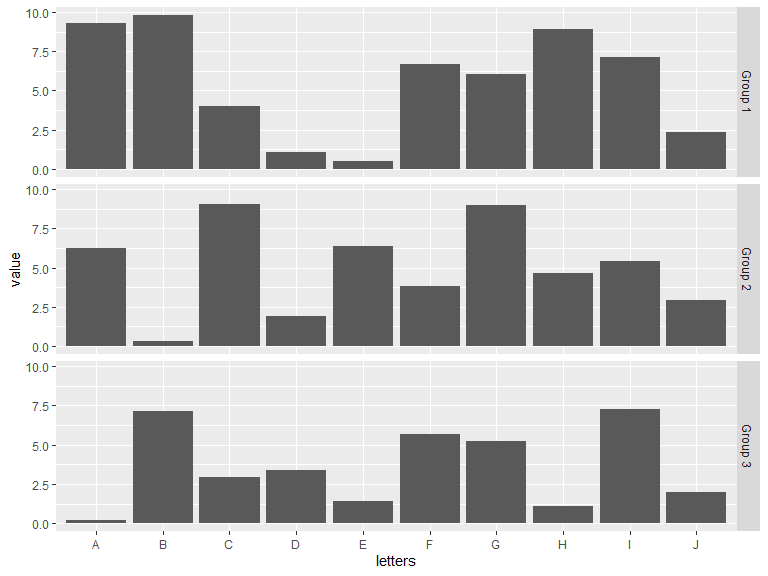
Using facet_grid with the switch = "x" places the strip to the right hand side:

ggplot(dat, aes(letters,value, label = letters)) + 
     geom_bar(stat="identity") + 
     facet_grid(grouping~., switch = "x")

Produces Fig.3:

Fig.3

With no other options remaining I turn here for help.

Pukka answered 13/6, 2020 at 6:9 Comment(6)
If you leave scales = 'free' out and just do facet_wrap(grouping~., dir = "v") you should get what you want.Deanadeanda
Hi @Deanadeanda thank you for your response. However, this is not my question at all. Perhaps my question was not very clear and I have modified my post. I need to use facet_grid() not facet_wrapt() to produce the plot; scales = 'free' does not help. Is there some way using facet_grid() to produce Fig.1. Thanking youPukka
This sounds like a version of the XY problem. What you really want is to have free space on the y-axis while keeping strip titles at the top of each plot, no? Or is there some other reason why you absolutely need to use facet_grid? For example, facet_col from the ggforce package may serve your needs. See discussion here.Fogarty
Thank you @Fogarty for your comment. Indeed, I do absolutely need to use facet_grid(). I tried facet_col() like facet_wrap() and it does not work for me. I will also change my post and mention facet_col() there for other people. The thing is my visualization is a bit more complex than the toy example I have created for stackoverflow. I will try to convert my code to something reproducible and post how facet_grid looks vs facet_col and facet_wrap look for my visualization. But nonetheless, yes, I do need to use facet_grid() and need to somehow place the strip on the "top" of the plot.Pukka
@FaizanKhalidMohsin, did you find a solution to this problem? I'm facing exactly the same problem as you did.Neruda
@RuamPimentel, Hi, I haven't been able to find a solution as of yet but did post on ggplot2 package manager thread to add to enable this, but have not had a response from them :( unfortunately.Pukka
Z
1

This is a workaround using facet_grid. I was not able to draw the gray stripes, but intermediate headings.

library("ggplot2")

dat <- data.frame(value=runif(30)*10,
                  grouping=c(rep("Group 1",10),
                             rep("Group 2",10),
                             rep("Group 3",10)),
                  letters=rep(LETTERS[1:10], 3))

indent <- max(nchar(unique(as.character(dat$grouping))))*4

ggplot(dat, aes(letters,value, label = letters)) + 
    geom_bar(stat="identity") + 
    facet_grid(grouping~., scales = "free_y", switch = "y")+ 
    theme(
        plot.margin = margin(1, 0.5, 0.25, 0.25, "cm"),
        panel.spacing.y = unit(2, "lines"),
        strip.placement = "outside",
        strip.clip = "off",
        strip.text.y.left = element_text(angle=0, vjust=1),
        strip.text.y = element_text(margin = margin(t=-15, r=-indent)),
        strip.background = element_blank()
    )

enter image description here

Zellers answered 21/6 at 7:33 Comment(0)
P
0

ggforce::facet_col() will do this. It's got strip.position argument as well as scales and space arguments

Pilaf answered 4/1 at 6:45 Comment(0)
E
0

Edit: I very much misunderstood so removed my previous response (thanks @RuiBarradas for pointing it out).

I don't know if using patchwork will work for your real data but below might do what you want. Basically, do each facet with facet_grid() separately then stack them.

library(dplyr)
library(ggplot2)
library(patchwork)

# your example data
dat <- data.frame(value=runif(30)*10,
                  grouping=c(rep("Group 1",10),
                             rep("Group 2",10),
                             rep("Group 3",10)),
                  letters=rep(LETTERS[1:10], 3))

# function to simplify making the pieces
plot_piece <- function(filter_value) {
  dat %>% 
    filter(grouping == filter_value) %>% 
    ggplot(aes(letters,value, label = letters)) + 
    geom_bar(stat = "identity") + 
    facet_grid(.~grouping, scales = "free_y", switch = "y")
}

# use the {patchwork} package to stack them nicely and 'collect' the axis labels
plot_piece("Group 1") / plot_piece("Group 2") / plot_piece("Group 3") + 
plot_layout(axis_title = "collect")

vertical facet_grid with the strips on top

Enisle answered 26/9 at 16:43 Comment(1)
The OP wants the plots stacked vertically, your 2nd solution places them side by side.Trig
D
-1

Is that what you want? Then just leave sales = 'free' out.

library(ggplot2)

dat <- data.frame(value=runif(26)*10,
                  grouping=c(rep("Group 1",10),
                             rep("Group 2",10),
                             rep("Group 3",6)),
                  letters=LETTERS[1:26])

ggplot(dat, aes(letters,value, label = letters)) + 
  geom_bar(stat="identity") + 
  facet_wrap(grouping~., dir = "v")

Created on 2020-06-13 by the reprex package (v0.3.0)

Deanadeanda answered 13/6, 2020 at 6:56 Comment(1)
Hi @Deanadeanda , No this not what I want. My question is how can the above graph be created using facet_grid() with the Group 1, Group 2, Group 3 strips on the top of the plots not using facet_wrap(). Thanking youPukka

© 2022 - 2024 — McMap. All rights reserved.