Weird streaks when working with a large Raster
Asked Answered
M

0

6

I have a large elevation raster from the ASTER database made by using raster::mosaic(). Each tile represents a one-degree by one-degree portion of the earth with an estimated raster resolution of 30m^2. I include the code that I used to mosaic them below, but I don't believe that it is the problem.

Mosaic <- do.call(mosaic,c(list of rasters, tolerance = 1, fun=mean)

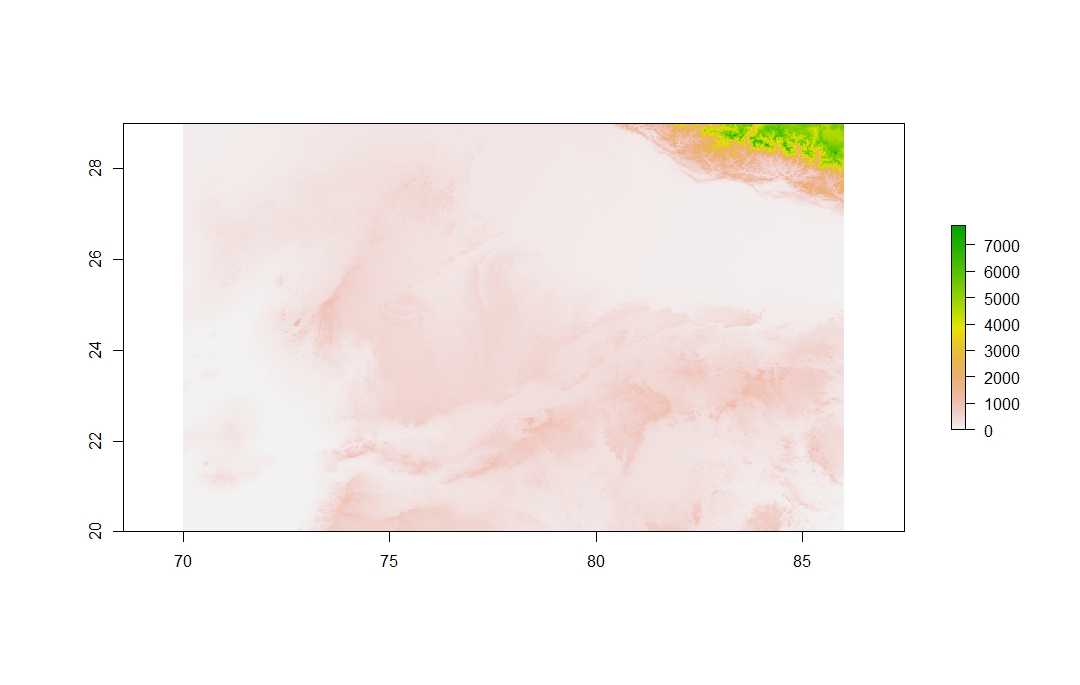
Once that is run, I get the following elevation tif, which you can DOWNLOAD HERE.

Image of Elevation Raster

I then measure the topographic ruggedness using raster::terrain(), using theTerrain Ruggedness Index as my method:

TRI <- terrain(Mosaic, opt="TRI")

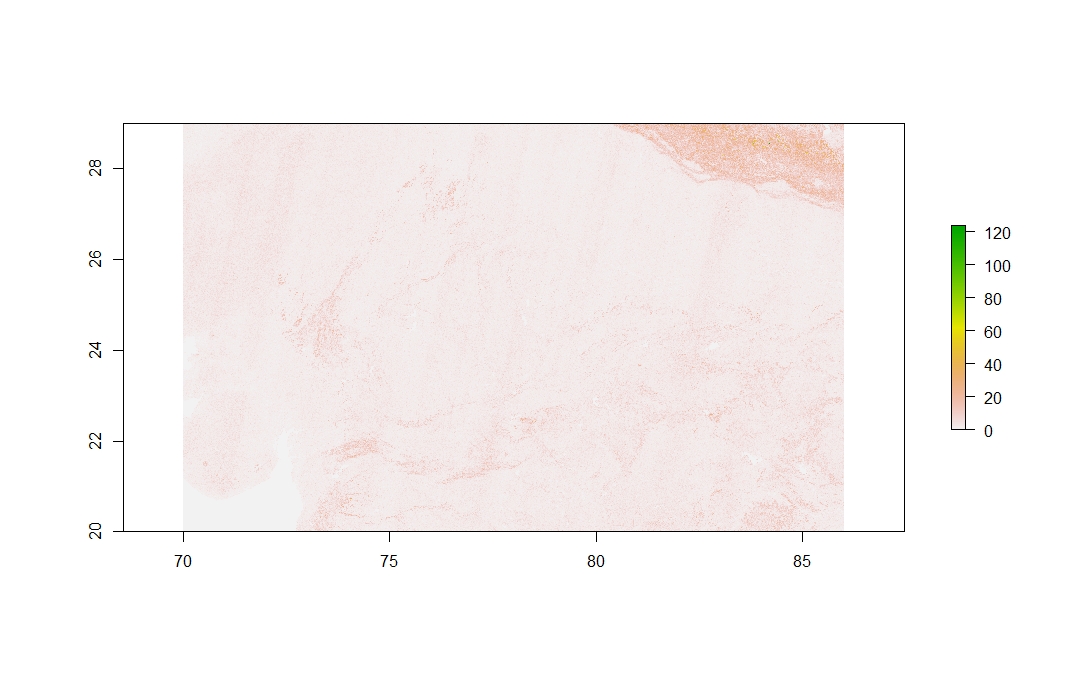
This yields:

TRI Raster

As you can see, there are faint streaks in the map which I cannot explain. Due to the full extent of my study, I need to aggregate this raster to a coarser resolution. Therefore I use the aggregate function in the raster package as well.

TRI_Agg <- aggregate(TRI,fact = 255, fun = mean)

This yields the following raster. TRI Aggregate
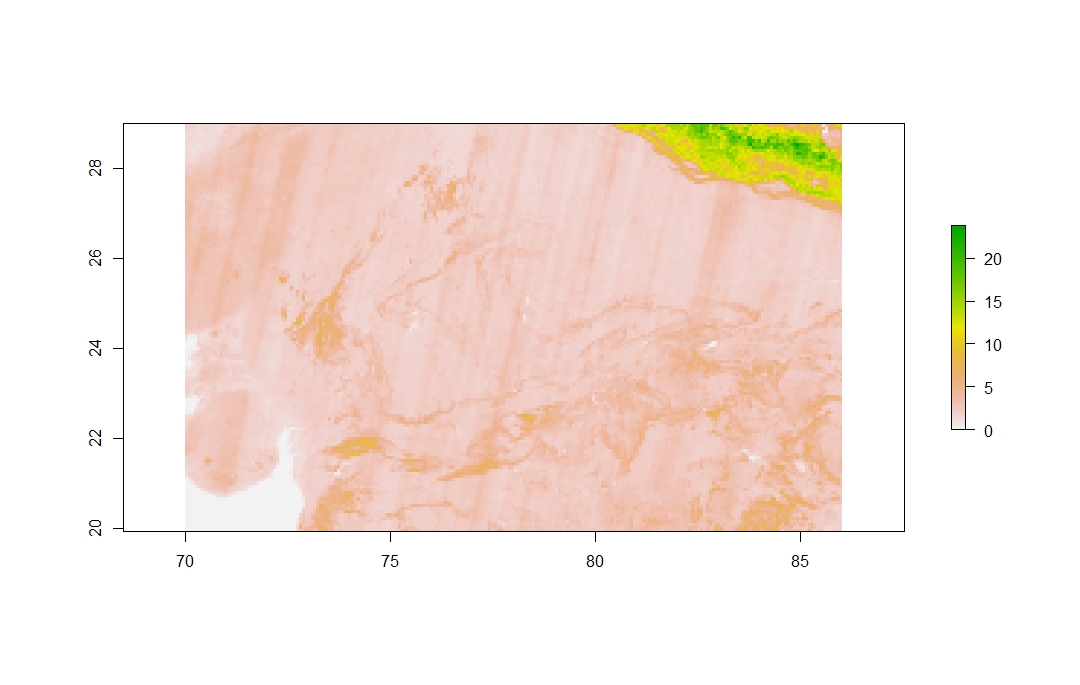
Here you can see that the streaks are much more pronounced and fairly consistent throughout the whole map. I tried doing this with other study areas and the problem persisted (i.e this would happen with raster tiles all around the world). I can't explain why those streaks are occurring. I have attempted different ways of going about this which include doing a neighborhood analysis (to fill in missing values if any) and processing the tiles before mosaicing them together. None of these have worked.

When I aggregate the raster before, the roughness calculation, the streaks do not appear which makes me believe this issue arises when using aggregate(). However, for my specific research question, I cannot calculate TRI using an aggregated raster.

Moorer answered 19/7, 2020 at 21:23 Comment(12)
Interesting. I have no idea what caused them, but wonder if the direction of the streaks is either parallel or perpendicular to the track of the satellite that took the images.Psalmody
Do the lines disappear if you aggregate first then do TRI?Wingfooted
The problem is that, for my particular research question, I need the fine-scale values to then calculate a mean of them. Even then, the problem persistsMoorer
You've got successive means, first in mosaic call, then again in TRI, that may be creating these seeming artifacts. Then again, perhaps your tolerance setting, which for ASTER would seemingly accept a pretty small differencing, similar to setting in help file of 0.05, as against your 1, this due to ASTER processing. Tolerance is "permissible difference in origin (relative to the cell resolution)", which might be a problem knitting different satellite system images, but you'd think ASTER knows it's neighbor ASTER.Wo
I tried doing it with a lower tolerance level and I, unfortunately, got the same result as before.Moorer
If you aggregate the elevation raster (before calculating roughness) and look closely, are the streaks present? I'm curious if the streaks are a byproduct of the roughness calculation, or if they're present in the data to begin with.Sivia
If you aggregate the raster before, no. The streaks do not appear. The problem is that for my calculation and specific research question, TRI cannot be calculated using an aggregated raster.Moorer
I'm pretty sure this is a problem with raster::aggregate. Is there a way you can make this problem more reproducible, say with an elevation raster using raster::getData()? See the docs ?getData() for examples.Sivia
I tried different ways of using the getData function and I did not succeed. Nonetheless, I have created a Google Drive folder with the data such as the previous raster. Here is the link for that (drive.google.com/drive/folders/…). The rasters are slowly uploading. There are 144 rasters total.Moorer
Try this: library(raster) ; france <- getData('alt', country='FRA', mask=TRUE) ; plot(france), see if you can make a reproducible example out of this, and if so, edit your question. It will remove barriers between people trying to solve your problem, because as it stands, in order to reproduce your problem, they need to download the massive dataset you've linked to.Sivia
Here is the data using the get data function. I tried doing the TRI calculation and it did not show the streaks. ' library(raster) India <- getData('alt', country='IND', mask=TRUE) India_tri <- terrain(India,opt="tri") 'Moorer
@RichPauloo I think you are right. I believe that the problem is the aggregate portion of the analyses. I tried doing the same process with other methods (other than TRI) and the same result happened.Moorer

© 2022 - 2024 — McMap. All rights reserved.