I have a ggplot2 element and a KableExtra table. Is it possible to combine them into one object with patchwork, cowplot or any other package and print it in an rmarkdown document? If there's not a solution, is there any other table package, with html or latex design, which I can use to solve this issue?
Is it possible to use custom blocks (https://bookdown.org/yihui/rmarkdown-cookbook/custom-blocks.html) to join these elements together? I tried without success.
Adding the table to ggplot as a custom_annotation won't work for me as I want to add many tables and plots to the same element.
> dt_example <- data.table(index = c('type', 'model', 'manufacturer', 'time', 'revolutions', 'element', 'fluid'), object = c('B12', 'Schullo', 'GM', '5 h', '54 k', 'XX', 'water'))
> dt_example
          index  object
1:         type     B12
2:        model Schullo
3: manufacturer      GM
4:         time     5 h
5:  revolutions    54 k
6:      element      XX
7:        fluid   water

kable_table <- dt_example %>%
    kable(col.names = c('',''), format = 'html', table.attr = "style='width:30%;'") %>%
    kable_styling() %>%
    pack_rows('model', 1, 5, label_row_css = "background-color: #FBFBFB;") %>%
    pack_rows('column', 6, 6, label_row_css = "background-color: #FBFBFB;") %>%
    pack_rows('fluid', 7, 7, label_row_css = "background-color: #FBFBFB;")

kable_table
which gives me the table below:
The ggplot element:
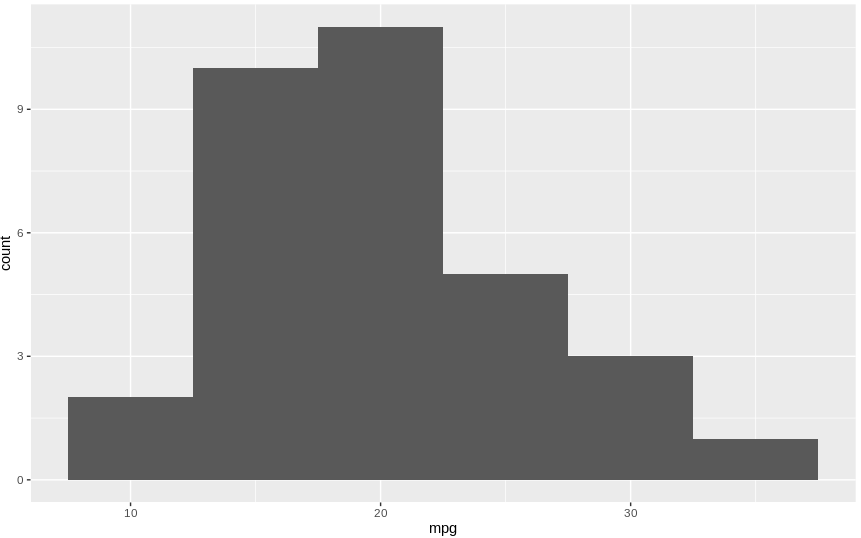
ggplot_element <- ggplot(mtcars,aes(x=mpg)) + geom_histogram(binwidth=5)

ggplot_element
And its output:
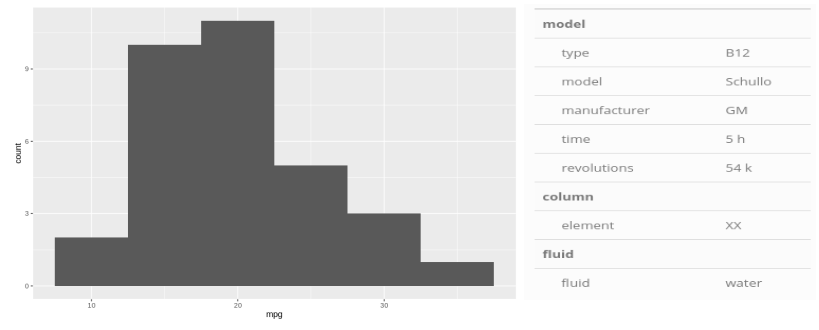
The desired output of the combination should be:


