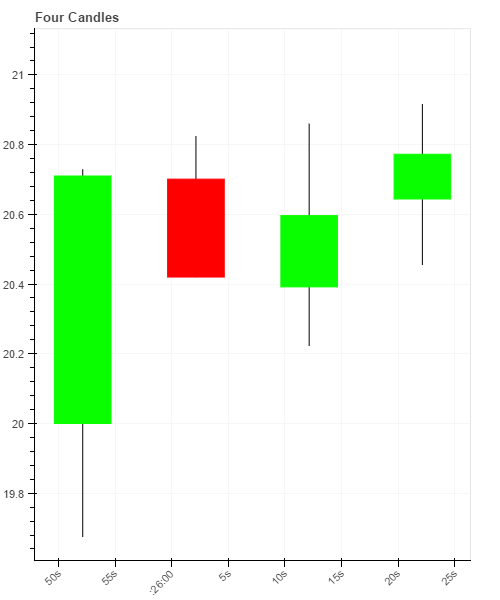
As a demonstration piece for proof-of-concept I've created a Bokeh plot of four OHLC candles.
I would like to extend the demo to animate the plot so that the current candlestick would be made to move and update in response to changes to its OHLC data. An important point is that only the components (glyphs?) of the final candle should be updated, NOT the entire plot.
The intent is to demonstrate an approach that is computationally lightweight and can be scaled up to a larger chart with many candles and very frequent updates to the 'live' candle.
Is anyone able to please outline or demonstrate in code how this could be accomplished?
With thanks.
Jupyter notebook Python code (Included is 39 seconds of synthetic tick data to facilitate a 4 x 10 second candlestick animation):
from ipywidgets import interact
import numpy as np
from bokeh.plotting import figure, output_notebook, show
import datetime as dt
import pandas as pd
from math import pi

datum = dt.datetime.now()
time_delta = dt.timedelta(seconds=1)

tick_data = [(datum + (time_delta*1), 20),
 (datum + (time_delta*2), 19.67603177022472),
 (datum + (time_delta*3), 20.431878609290592),
 (datum + (time_delta*4), 20.20576131687243),
 (datum + (time_delta*5), 20.715609070433032),
 (datum + (time_delta*6), 20.722416975732024),
 (datum + (time_delta*7), 20.722027468712426),
 (datum + (time_delta*8), 20.728022489796615),
 (datum + (time_delta*9), 20.70996968619282),
 (datum + (time_delta*10), 20.70096021947874),
 (datum + (time_delta*11), 20.729546647699372),
 (datum + (time_delta*12), 20.759081440837274),
 (datum + (time_delta*13), 20.823807346441097),
 (datum + (time_delta*14), 20.610018797947472),
 (datum + (time_delta*15), 20.591932124168064),
 (datum + (time_delta*16), 20.584175853951805),
 (datum + (time_delta*17), 20.563650527527987),
 (datum + (time_delta*18), 20.617504106758794),
 (datum + (time_delta*19), 20.42010872326373),
 (datum + (time_delta*20), 20.391860996799267),
 (datum + (time_delta*21), 20.3913190739894),
 (datum + (time_delta*22), 20.34308794391099),
 (datum + (time_delta*23), 20.2225778590662),
 (datum + (time_delta*24), 20.47050754458162),
 (datum + (time_delta*25), 20.83193618858914),
 (datum + (time_delta*26), 20.80978509373571),
 (datum + (time_delta*27), 20.80917543057461),
 (datum + (time_delta*28), 20.859506511541262),
 (datum + (time_delta*29), 20.596402987349492),
 (datum + (time_delta*30), 20.644024454266795),
 (datum + (time_delta*31), 20.58183881183424),
 (datum + (time_delta*32), 20.59023861538722),
 (datum + (time_delta*33), 20.454961133973477),
 (datum + (time_delta*34), 20.495334383308776),
 (datum + (time_delta*35), 20.483818523599044),
 (datum + (time_delta*36), 20.593964334705078),
 (datum + (time_delta*37), 20.91518908025538),
 (datum + (time_delta*38), 20.87942217480398),
 (datum + (time_delta*39), 20.772392419854697)]


#Prepare to convert fractal tick data into candlesticks
candle_delta = dt.timedelta(seconds=10)
candle_close_time = datum + candle_delta
candle_data = []

#Initialise
op, hi, lo, cl = 0, 0, 0, 0

#Convert ticks to candlesticks
for (dtval, val) in tick_data:
    if candle_close_time < dtval:
        #store the completed candle
        candle_data.append((candle_close_time, op, hi, lo, cl))
        #increment to the next candle
        candle_close_time += candle_delta
        #Reset
        op, hi, lo, cl = 0, 0, 0, 0

    if dtval <= candle_close_time and op==0:
        #set initial values
        op, hi, lo, cl = val, val, val, val
    elif dtval <= candle_close_time and op!=0:
        #update values as appropriate
        hi = val if val > hi else hi
        lo = val if val < lo else lo
        cl = val

    #final tick
    if dtval == tick_data[-1][0]:
        #store the completed candle
        candle_data.append((candle_close_time, op, hi, lo, cl))

#print(str(candle_data))

df = pd.DataFrame(candle_data, columns=list('dohlc'))

#For rectangle positioning
mids = (df.o + df.c)/2
#Rectangle height
spans = abs(df.c-df.o)
#Detect up / down candle body
inc = df.c > df.o
dec = df.o > df.c
#Candle width
w = 10 * 500

TOOLS = "pan,wheel_zoom,box_zoom,reset,save"
p = figure(x_axis_type="datetime", tools=TOOLS, plot_width=500, title = "Four Candles")

p.xaxis.major_label_orientation = pi/4
p.grid.grid_line_alpha=0.3

#Wick
p.segment(df.d, df.h, df.d, df.l, color="#000000")
#Up body
p.rect(df.d[inc], mids[inc], w, spans[inc], fill_color="#09ff00", line_color="#09ff00")
#Down body
p.rect(df.d[dec], mids[dec], w, spans[dec], fill_color="#ff0000", line_color="#ff0000")


output_notebook()
show(p)

