Can't Change Metric Alias in Grafana Using a Zabbix Plugin
Asked Answered
G

2

6

I want to show multiple CPU Usage from different hosts in one graph but they all end up with the same name and I can't tell which line represents which host: here's the snapshot.

I'm using Grafana 5.2.4 with a Zabbix plugin 3.9.1. My Zabbix version is 3.0.12. I've tried overriding legends in Grafana but there's no such option. Also, Zabbix plugin doesn't allow connecting directly to DB, so I can't use the ALIAS BY option either. I've tried using macros in Zabbix to include host name in item name, but {HOST.NAME} just ends up as is in the item name (and not replaced by the actual values).

Any solutions will be hugely appreciated.

Galvin answered 25/9, 2018 at 7:8 Comment(5)
Did you use the templating feature? Or a regexp or multiple metrics?Electrocute
I tried using macros in Configuration>templates>itemsGalvin
Sorry, I meant if you did use templating in Grafana, to enable multiple item selection. Could you share the configuration of your Grafana metrics?Electrocute
No I'm not familiar with templating in Grafana, unfortunately.Galvin
imgur.com/a/Od2dLDI you can find my metrics configuration in this image. Thanks a lot.Galvin
E
1

You should use the templating feature of the Zabbix Grafana plugin,see the attached screens and the following description for a working example.

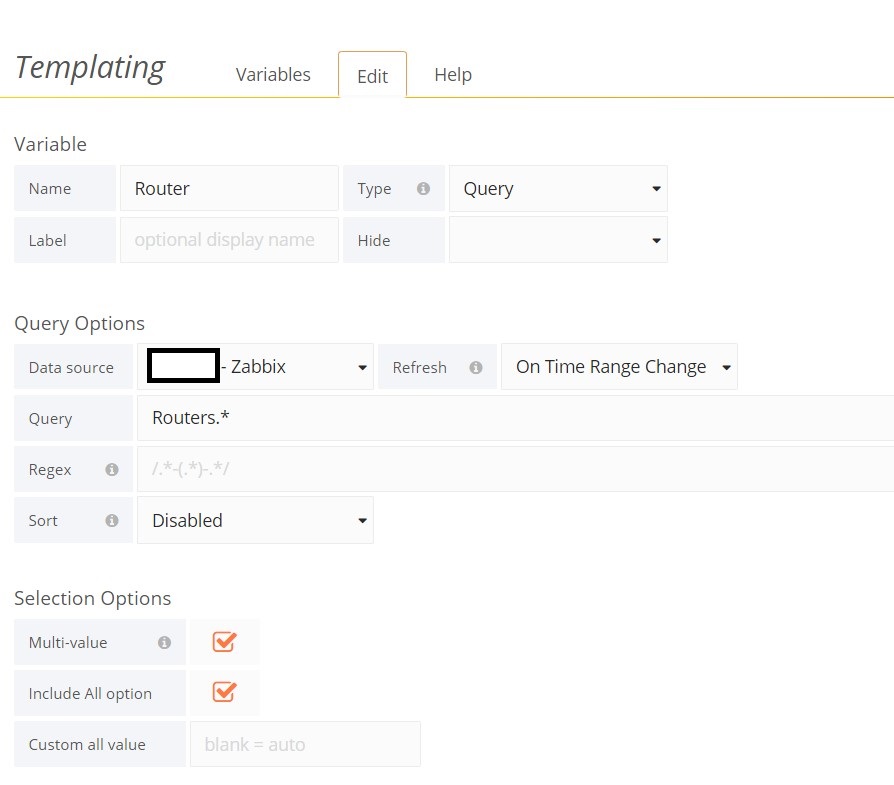
I have a Routers Zabbix Hostgroup, so I define a Router Grafana variable to match the hosts (Routers.*), see the first screenshot. Enable both multi-value and Select All enter image description here

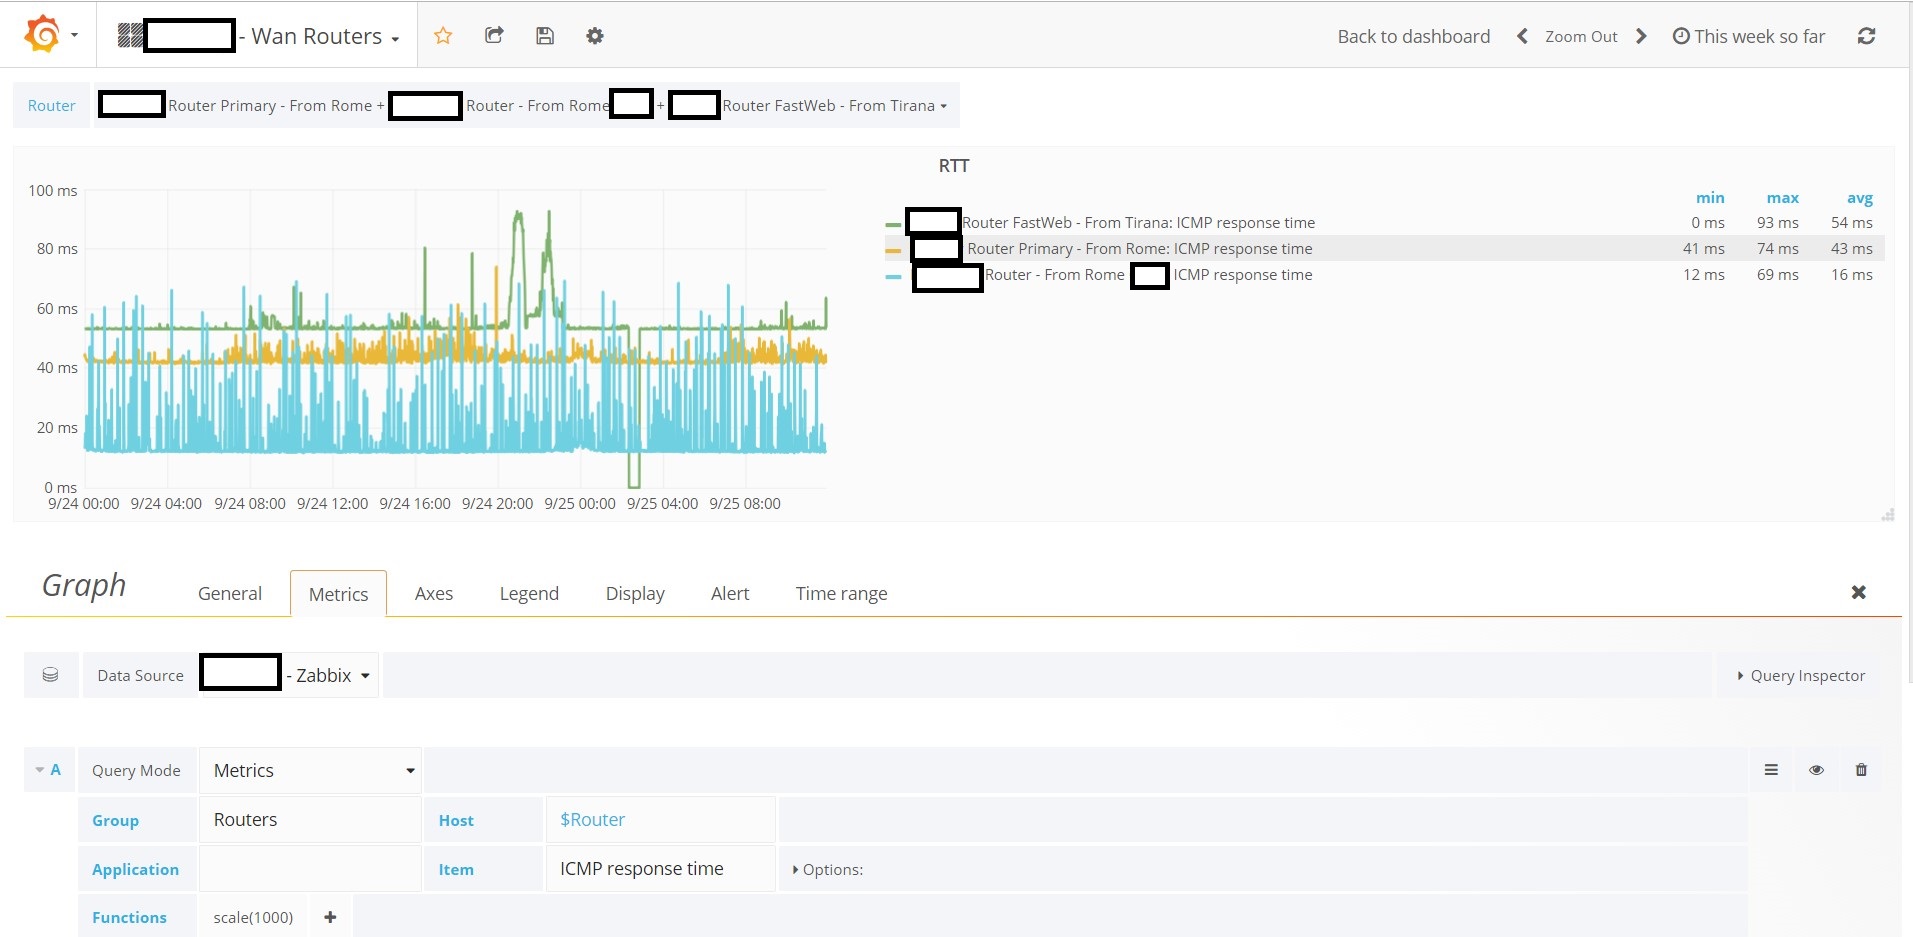
Then in the metrics configuration use a single metric configured this way:

  • Group: Routers
  • Host: $Router (mind the $, the variable will be expanded in real time accordingly to the selection)
  • Item: the common item name (i.e.: ICMP Response Time)

And you will get something similar to the second screenshot, with a host picker on top and multiple selections.

enter image description here

Electrocute answered 25/9, 2018 at 11:1 Comment(1)
Thank you so much. I tested your solution and it worked. I found another very obvious solution which I'm gonna explain in a separate answer, but your solution is much easier and more automatic.Galvin
G
0

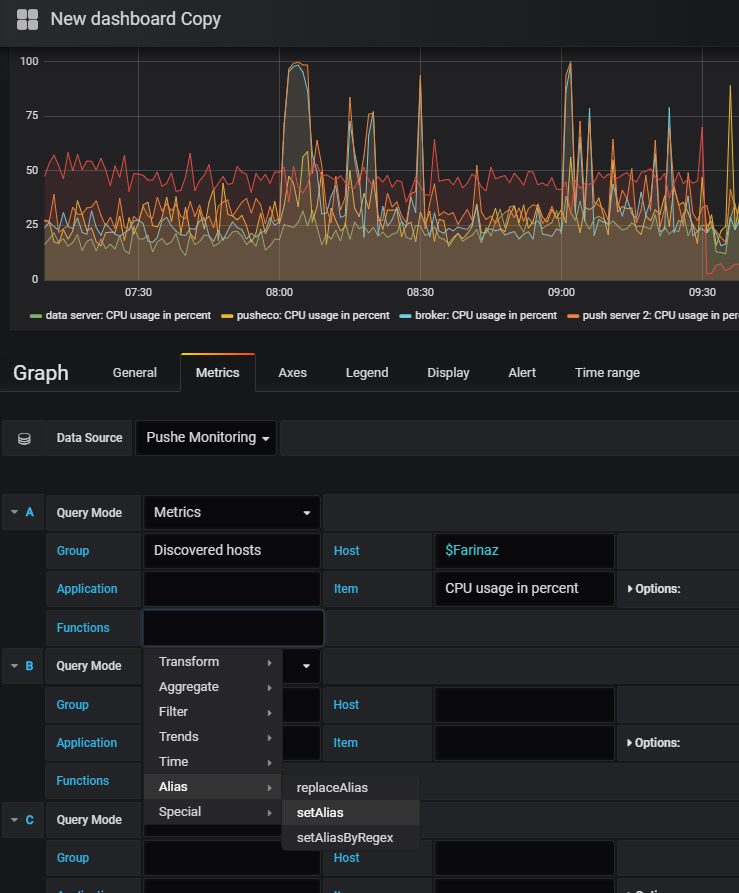
So There's a "Functions" button below each metric when we are configuring and editing our graph. There's an "Alias" option and when you hover over it you see more options. If you click on "setAlias", you can define an alias for each metric. Since this solution requires setting each alias individually, I recommend the solution that was suggested by Simone Zabberoni above. but this one is also worth knowing since it might come in handy at times. enter image description here

Galvin answered 26/9, 2018 at 9:51 Comment(0)

© 2022 - 2024 — McMap. All rights reserved.