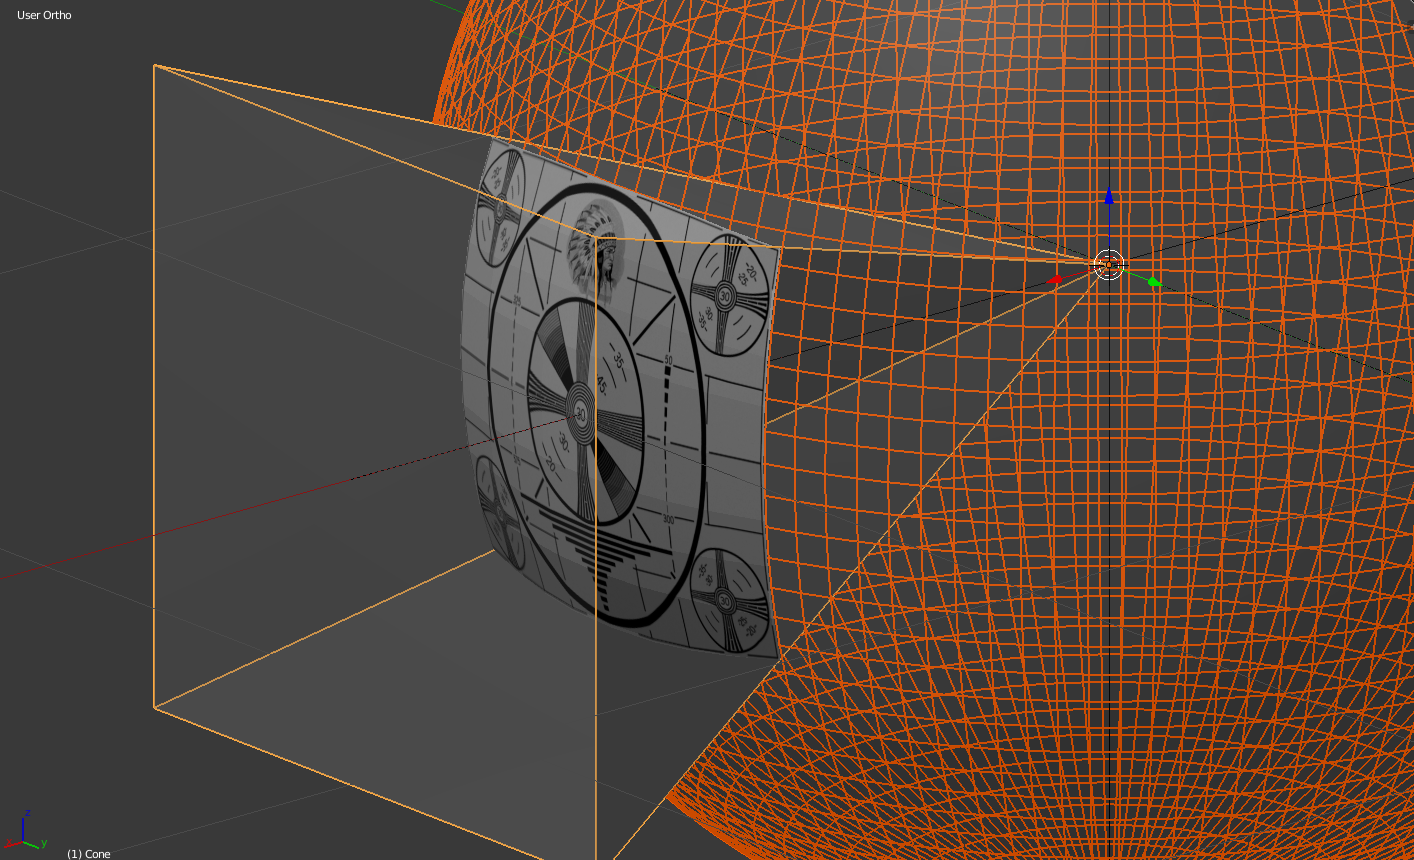
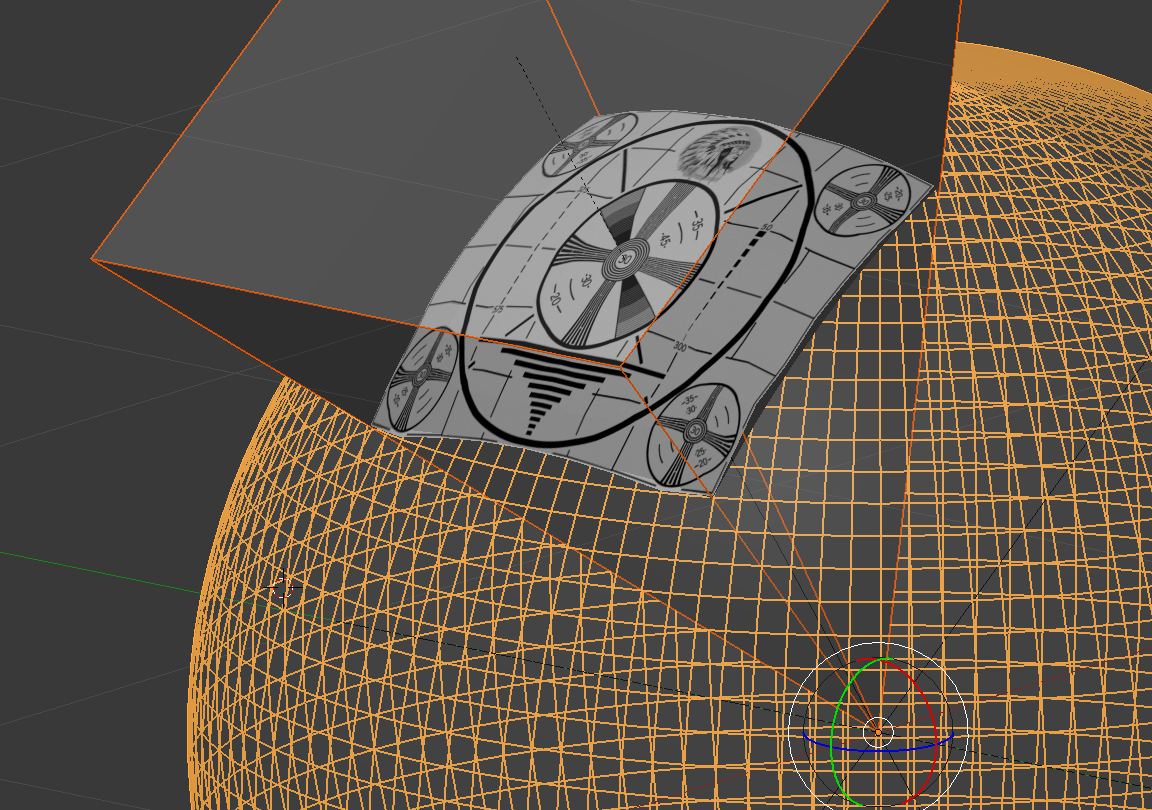
i want to figure out how to properly calculate vizibility zone and draw it using d3.geo projections. visibility zone in my case is optical camera frustum
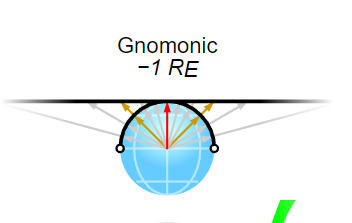
for now, i have a two plots, both represent azimuth and elevation from view point, one in gnomonic (according to wiki) projection:
// this magic number is experimentally found
//pixels in one degree in gnomonic projection chart with scale 1500
var px = 26.8;
Width and height below is a optical camera view angles in degrees by azimuth and elevation axes
var w = px * viewport.width;
var h = px * viewport.height;

d3.geoGnomonic()
  .translate([w / 2, h / 2])
  .scale(1500)
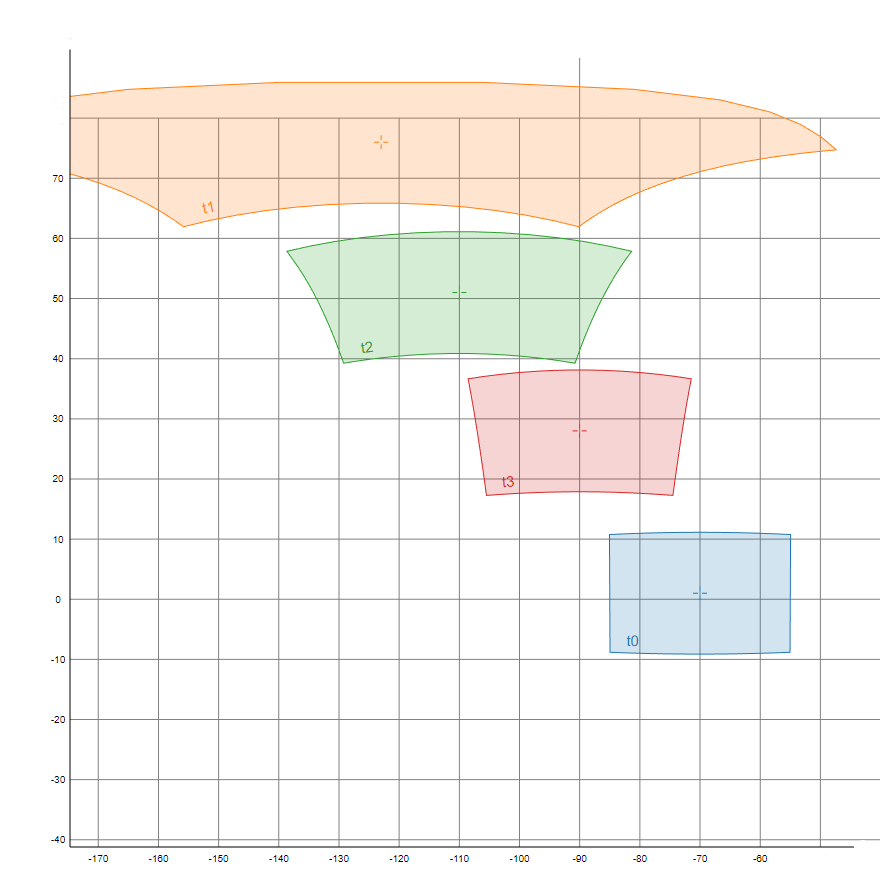
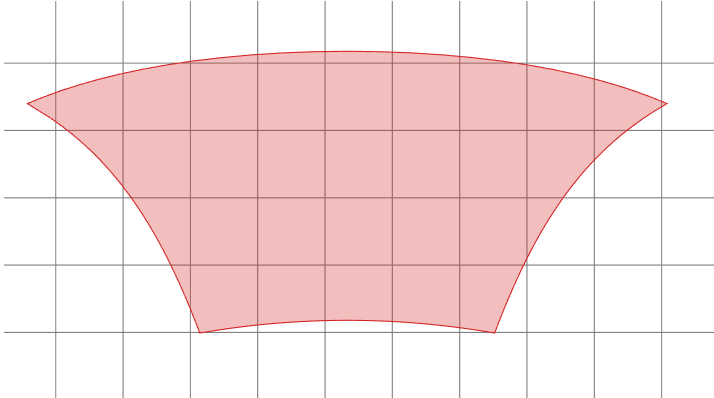
on gnomonic plot i've placed points by its border, then reproject these points using d3.projection.invert method and used resulting angles on d3.geoEquirectangular projection plot to draw areas(like here), with following results:
viewport here is a size of frustum in angles
current method is wrong, but gives me approximate result
i want to figure out what is wrong in my scenario..
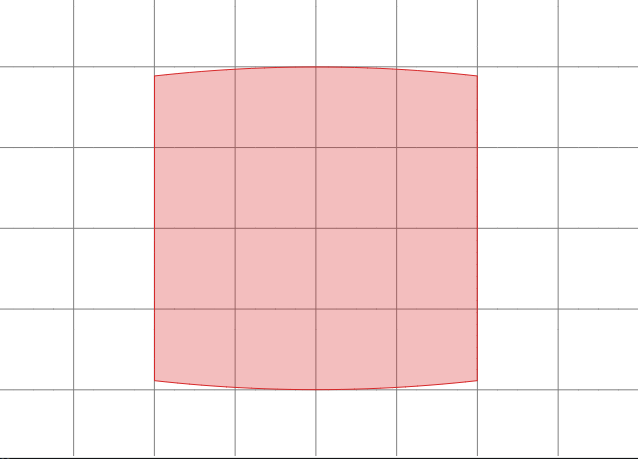
ps: i've extracted minimum example, it differs from original code but has same bug: here you can see that size by horizontal axis differs from input size (must be 10, 20, 30, 40 degrees)
Suggestions and comments are appriciated. Thanks for reading!
var d3 = window.d3;
    var colorGenerator = d3.scaleOrdinal(d3.schemeCategory10);
    var bounds = [650, 500];
    var projection = d3.geoEquirectangular().translate([bounds[0]/2, bounds[1]/2]);
    var geoPath = d3.geoPath().projection(projection);


    var zoom = d3.zoom()
        .scaleExtent([1, 1000])
        .translateExtent([[0, 0], bounds])
        .on("zoom", zoomed);

    var svg = d3.select('body')
        .append('svg')
        .attr("width", bounds[0])
        .attr("height", bounds[1])
        .attr("viewbox", "0 0 " + bounds[0] + " " + bounds[1])
        .call(zoom)
        .append('g');

    svg.append("g")
        .append("path")
        .datum(d3.geoGraticule())
        .attr("stroke", "gray")
        .attr("d", geoPath);

    d3.range(0, 4).forEach(function (i) {
        var size = (i + 1) * 10;
        addVisibilityZone([-130 + size * 5, 50],
            colorGenerator(i), [size, size]);
    });

    function zoomed() {
        var t = d3.event.transform;
        svg.attr("transform", t);
        d3.selectAll("path").attr('stroke-width', 1/t.k);
    }

    function addVisibilityZone(angles, color, size) {

        var xy = projection(angles);

        var points = generateRect(100, 0, 0, size[0], size[1]);

        var gnomonicProjection = d3.geoGnomonic().clipAngle(180)
            .translate([size[0]/2, size[1]/2])
            .scale(57);  // this magic number is experimentally found

        var g = svg.append("g");

        var drag = d3.drag()
            .on("start", dragged)
            .on("drag", dragged);

        var path = g.append("path")
            .datum({
                type: "Polygon",
                coordinates: [[]],
            })
            .classed("zone", "true")
            .attr("fill", color)
            .attr("stroke", color)
            .attr("fill-opacity", 0.3)
            .call(drag);

        update();

        function dragged() {

            g.raise();
            xy = [d3.event.x, d3.event.y];
            update()
        }

        function update() {
            angles = projection.invert(xy);
            gnomonicProjection.rotate([-angles[0], -angles[1]]);
            path.datum().coordinates[0] = points.map(gnomonicProjection.invert);
            path.attr('d', geoPath);
        }
    }

    function generateRect(num, x, y, width, height) {
      var count = Math.floor(num / 4) + 1;
      var range = d3.range(count);
      return range.map(function (i) { // top
        return pt(i * width / count, 0);
      }).concat(range.map(function (i) { // right
        return pt(width, i * height / count);
      })).concat(range.map(function (i) { // bottom
        return pt(width - i * width / count, height);
      })).concat(range.map(function (i) { // left
        return pt(0, height - i * height / count);
      }));

      function pt(dx, dy) {
        return [x + dx, y + dy];
      }
    }
* {
margin: 0;
overflow: hidden;
}<script src="//d3js.org/d3.v5.min.js"></script>
