When I run this command ng test --browsers=ChromeHeadless --source-map=false --code-coverage=true --watch=true, I note that my tests return the following code-coverage summary:
Code Coverage Without Source Maps - Numbers seem right.
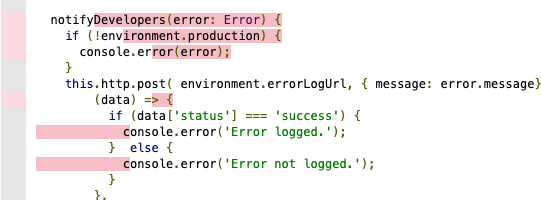
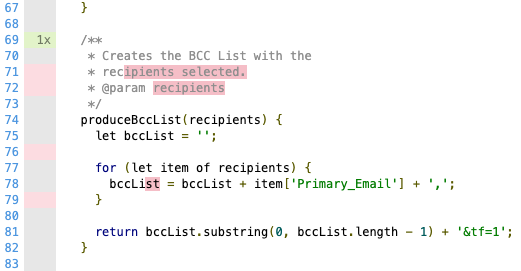
However, the code coverage as it appears in my coverage/ directory has some nonsensical highlighting going on. See these examples:
Example 1 Without Source Maps - Highlighting seems wrong. (Only pieces of lines listed as untested?)
Example 2 Without Source Maps - Highlighting seems wrong. (Only pieces of lines listed as untested?)
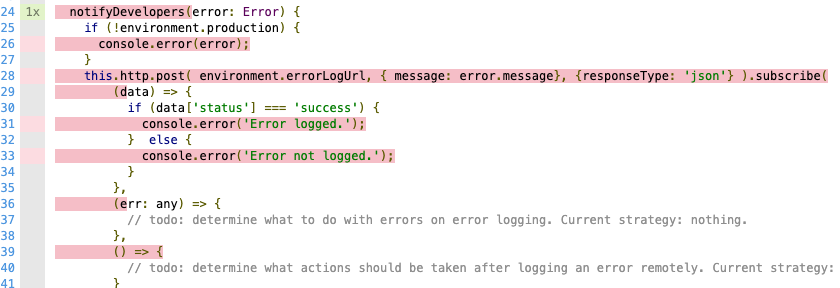
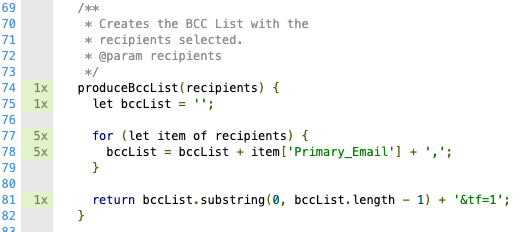
Now, when I run the following command, ng test --browsers=ChromeHeadless --source-map=true --code-coverage=true --watch=true (NOTE: THE ONLY CHANGE IS THE SOURCE MAP VALUE), I get incorrect code coverage numbers but the highlighting is fixed. See below.
Code Coverage With Source Maps - Numbers seem off.
Example 1 With Source Maps - Highlighting seems right.
Example 2 With Source Maps - Highlighting seems right.
There are other abnormalities that appear while using source maps too, like my test suite registering that it Executed 37 of 35 tests successfully.
Why does using Source Maps cause this much of a difference in my code coverage? Shouldn't the numbers and statistics be the same whether I am using Source Maps or not? Similarly, shouldn't the same lines be highlighted exactly the same way whether I'm using Source Maps or not?
Why the discrepancy?


