Create polygons from points with GeoPandas
Asked Answered
O

3

6

I have a geopandas dataframe containing a list of shapely POINT geometries. There is another column with a list of ID's that specifies which unique polygon each point belongs to. Simplified input code is:

import pandas as pd
from shapely.geometry import Point, LineString, Polygon
from geopandas import GeoDataFrame

data = [[1,10,10],[1,15,20],[1,20,10],[2,30,30],[2,35,40],[2,40,30]] 
df_poly = pd.DataFrame(data, columns = ['poly_ID','lon', 'lat']) 
geometry = [Point(xy) for xy in zip(df_poly.lon, df_poly.lat)]
geodf_poly = GeoDataFrame(df_poly, geometry=geometry)
geodf_poly.head()

I would like to groupby the poly_ID in order to convert the geometry from POINT to POLYGON. This output would essentially look like:

poly_ID   geometry
1         POLYGON ((10 10, 15 20, 20 10))
2         POLYGON ((30 30, 35 40, 40 30))

I imagine this is quite simple, but I'm having trouble getting it to work. I found the following code that allowed me to convert it to open ended polylines, but have not been able to figure it out for polygons. Can anyone suggest how to adapt this?

geodf_poly = geodf_poly.groupby(['poly_ID'])['geometry'].apply(lambda x: LineString(x.tolist()))

Simply replacing LineString with Polygon results in TypeError: object of type 'Point' has no len()

Oldham answered 23/2, 2020 at 2:27 Comment(2)
can you post your input & expected output as text & not as picture?Benzoic
Thanks @Benzoic . I have added input and desired output text/code to the original question.Oldham
B
1

Your request is a bit tricky to accomplish in Pandas because, in your output you want the text 'POLYGON' but numbers inside the brackets.

See the below options work for you

from itertools import chain
df_poly.groupby('poly_ID').agg(list).apply(lambda x: tuple(chain.from_iterable(zip(x['lon'], x['lat']))), axis=1).reset_index(name='geometry')

output

poly_ID     geometry
0   1   (10, 10, 15, 20, 20, 10)
1   2   (30, 30, 35, 40, 40, 30)

or

from itertools import chain

df_new =df_poly.groupby('poly_ID').agg(list).apply(lambda x: tuple(chain.from_iterable(zip(x['lon'], x['lat']))), axis=1).reset_index(name='geometry')
df_new['geometry']=df_new.apply(lambda x: 'POLYGON ('+str(x['geometry'])+')',axis=1 )
df_new

Output

poly_ID     geometry
0   1   POLYGON ((10, 10, 15, 20, 20, 10))
1   2   POLYGON ((30, 30, 35, 40, 40, 30))

Note: Column geometry is a string & I am not sure you can feed this directly into Shapely

Benzoic answered 23/2, 2020 at 5:1 Comment(2)
Thanks for the quick reply @Benzoic - I can see this generates something that 'looks' right, but like you said, I'm not sure whether this is creating proper shapely point geometry? The following line of code correctly converts the input to plotly Linestring geometry (without any need to concatenate the text 'linestring' on the front), so I thought there would be something similar to convert to Polygon. geodf_poly = geodf_poly.groupby(['polygon_ID'])['geometry'].apply(lambda x: LineString(x.tolist()))Oldham
Another solution: gis.stackexchange.com/questions/294206/…Pendentive
R
0

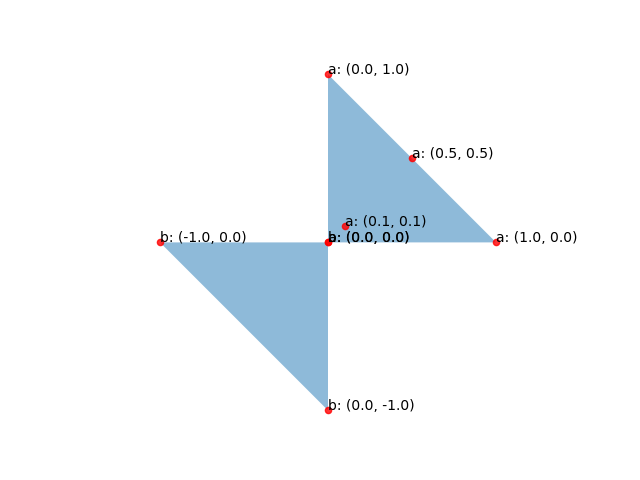
This solution works for large data via .dissolve and .convex_hull.

>>> import pandas as pd
>>> import geopandas as gpd
>>> df = pd.DataFrame(
...     {
...         "x": [0, 1, 0.1, 0.5, 0, 0, -1, 0],
...         "y": [0, 0, 0.1, 0.5, 1, 0, 0, -1],
...         "label": ['a', 'a', 'a', 'a', 'a', 'b', 'b', 'b'],
...     }
... )
>>> gdf = geopandas.GeoDataFrame(
...     df,
...     geometry=gpd.points_from_xy(df["x"], df["y"]),
... )
>>> gdf
     x    y  label                  geometry
0  0.0  0.0      a   POINT (0.00000 0.00000)
1  1.0  1.0      a   POINT (1.00000 1.00000)
2  0.1  0.1      a   POINT (0.10000 0.10000)
3  0.5  0.5      a   POINT (0.50000 0.50000)
4  0.0  1.0      a   POINT (0.00000 1.00000)
5  0.0  0.0      b   POINT (0.00000 0.00000)
6 -1.0  0.0      b  POINT (-1.00000 0.00000)
7  0.0 -1.0      b  POINT (0.00000 -1.00000)
>>> res = gdf.dissolve("label").convex_hull
>>> res.to_wkt()
label
a       POLYGON ((0 0, 0 1, 1 0, 0 0))
b    POLYGON ((0 -1, -1 0, 0 0, 0 -1))
dtype: object

enter image description here

Roturier answered 25/8, 2022 at 5:17 Comment(0)
M
0

we made it like that...

You can use this function.

import numpy as np
import geopandas as gpd
import pandas as pd
import typing

def signal_polygon(point:gpd.GeoSeries, azimut: typing.Union[float, pd.Series], width: typing.Union[float, pd.Series],distance: typing.Union[float, pd.Series]) -> gpd.GeoSeries:
    
    """ Generating of sector
    Args:
        point (gpd.GeoSeries): BTS position of Transceiver
        azimut (typing.Union[float, pd.Series]): 
        width (typing.Union[float, pd.Series]): Width of emmiting in degrees
        distance (typing.Union[float, pd.Series]): Distance of emmiting in meters
    Returns:
        gpd.GeoSeries: Series with Transceiver
    """
    original_crs = point.crs
    default_crs = "EPSG:5514" ## Valuable for middle Europe

    rotation = 7
    point = point.to_crs(default_crs) # Metric mercator
    buffered_point = point.buffer(distance)
    point_x = point.x
    point_y = point.y
    distance_intersect = distance*2
    point_a = gpd.GeoSeries(
                    gpd.points_from_xy(
                        point_x + np.sin((azimut+rotation-width/2)/180*np.pi)*(distance_intersect), 
                        point_y + np.cos((azimut+rotation-width/2)/180*np.pi)*(distance_intersect)), 
                        crs=default_crs
                        )
    point_b = gpd.GeoSeries(
                    gpd.points_from_xy(
                        point_x + np.sin((azimut+rotation+width/2)/180*np.pi)*(distance_intersect), 
                        point_y + np.cos((azimut+rotation+width/2)/180*np.pi)*(distance_intersect)), 
                        crs=default_crs
                        )
    point_c = gpd.GeoSeries(
                    gpd.points_from_xy(
                        point_x + np.sin((azimut+rotation)/180*np.pi)*(np.sqrt(2)*distance_intersect), 
                        point_y + np.cos((azimut+rotation)/180*np.pi)*(np.sqrt(2)*distance_intersect)), 
                        crs=default_crs
                        )
    polygon = (point_a.union(point).union(point_b).union(point_c)).convex_hull
    signal = polygon.intersection(buffered_point)
    #signal = signal.to_crs(original_crs)
    return signal

Basicaly you need for input simmilar geodataframe like this:

AZIMUT cell_id geometry
60 17227 POINT (17.45152 49.07207)
300 14633 POINT (17.93526 49.92660)

Then, you can use the function like that

name_gdf["geom"] = signal_polygon(name_gdf["geometry"], name_gdf["AZIMUT"], 90, 500)

AZIMUT cell_id geometry
60 17227 POLYGON ((-538327.125 -1180638.334, -538139.89...
300 14633 POLYGON ((-494581.727 -1089284.222, -495076.27...
Mcclurg answered 26/6 at 6:20 Comment(0)

© 2022 - 2024 — McMap. All rights reserved.