update:
VNC into the build machine (without making any changes) somehow fixes this....strange
Context
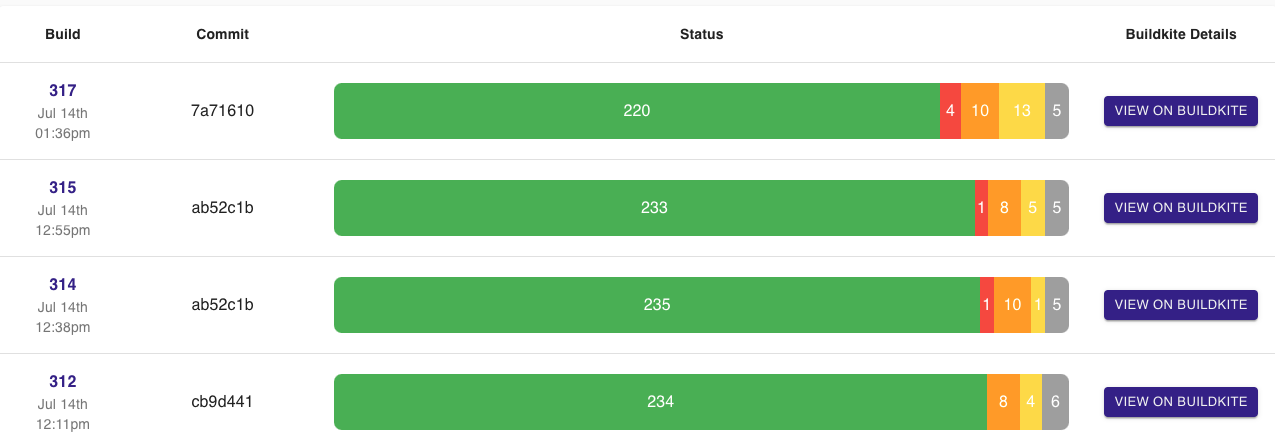
We use Mac EC2 instances CI cluster to run UI tests. The cluster is set up to recycle every night. Meaning new cluster is provisioned in the morning. We notice that the tests get increasing more and more flaky throughout the day.
- Build 312 is the first build in the morning.
- Red is failed tests, Orange is silenced tests, Yellow is flaky tests, Grey is unknown status
- The commit are just white space auto commit that trigger off builds. The tests content are the same.
- Note: Bluepill configure to run one Simulator per machine (no concurrency)
Log
The flaky test or failure are usually due to "waiting for some resource to idle" and reach timeout, or some network request to finish. The tests that failed or flaky also has a commonality which is they are usually related to video
Here are a couple sample logs
Waiting for app to idle
Timed out waiting for app to idle.
The following idling resources are busy.
1. GREYAppStateTracker:
Waiting for network requests to finish. By default, EarlGrey tracks all network requests. To change this behavior, refer to GREYConfiguration.
<__NSCFLocalDataTask:0x7fcfcfd87450, URL:"https://v.myorgimg.com/videos/mc/hls/e7/01/ca/e701caebac12684056eb699f316fc411_360w.m3u8"> => Waiting for network requests to finish. By default, EarlGrey tracks all network requests. To change this behavior, refer to GREYConfiguration.
(
    0   MyorgDevelopmentEG2             0x000000010ebf3205 -[GREYAppStateTrackerObject setState:] + 69
    1   MyorgDevelopmentEG2             0x000000010ebf22b3 __133-[GREYAppStateTracker grey_changeState:usingOperation:forObject:orInternalObjectDeallocationTracker:orExternalAppStateTrackerObject:]_block_invoke + 931
    2   MyorgDevelopmentEG2             0x000000010ebf18f0 -[GREYAppStateTracker grey_performBlockInCriticalSection:] + 224
    3   MyorgDevelopmentEG2             0x000000010ebf1e34 -[GREYAppStateTracker grey_changeState:usingOperation:forObject:orInternalObjectDeallocationTracker:orExternalAppStateTrackerObject:] + 1076
    4   MyorgDevelopmentEG2             0x000000010ebf0ac6 -[GREYAppStateTracker trackState:forObject:] + 102
    5   MyorgDevelopmentEG2             0x000000010ebca867 -[__NSCFLocalDataTask_GREYApp grey_track] + 135
    6   MyorgDevelopmentEG2             0x000000010ebcac55 -[__NSCFLocalDataTask_GREYApp greyswizzled_resume] + 181
    7   MediaToolbox                        0x00007fff2b617285 figHttpRequestSetupNSURLSessionTask + 1380
    8   MediaToolbox                        0x00007fff2b616bb6 _FigHTTPRequestCreateWithNSURLSession + 2923
    9   MediaToolbox                        0x00007fff2b64aaaf figHTTPRequestSessionNSCreateHTTPRequest + 199
    10  MediaToolbox                        0x00007fff2b71f5b1 segPumpCreateHTTPRequest + 944
    11  MediaToolbox                        0x00007fff2b721de6 segPumpSendIndexFileRequest + 1703
    12  MediaToolbox                        0x00007fff2b7431d5 segPumpRequestIndexForStream + 753
    13  MediaToolbox                        0x00007fff2b7421ee segPumpSetAlternateForStream + 3145
    14  MediaToolbox                        0x00007fff2b73e9e5 segPumpSetCurrentAlternate + 9898
    15  MediaToolbox                        0x00007fff2b791d6a ProduceStreamingAssetProperty + 661
    16  MediaToolbox                        0x00007fff2b78e07c URLAssetPropertyWorkFunction + 872
    17  libdispatch.dylib                   0x00007fff201078df _dispatch_client_callout + 8
    18  libdispatch.dylib                   0x00007fff2010de15 _dispatch_lane_serial_drain + 715
    19  libdispatch.dylib                   0x00007fff2010e9c3 _dispatch_lane_invoke + 455
    20  libdispatch.dylib                   0x00007fff20117a8e _dispatch_root_queue_drain + 350
    21  libdispatch.dylib                   0x00007fff2011786c _dispatch_worker_thread + 222
    22  libsystem_pthread.dylib             0x00007fff60342950 _pthread_start + 224
    23  libsystem_pthread.dylib             0x00007fff6033e47b thread_start + 15
)
and waiting for network request to finish
9. GREYAppStateTracker:
Waiting for network requests to finish. By default, EarlGrey tracks all network requests. To change this behavior, refer to GREYConfiguration.
Waiting for UIView's draw/layout pass to complete. A draw/layout pass normally completes in the next runloop drain.
<ASCollectionView: 0x7feca21ad000> => Waiting for UIView's draw/layout pass to complete. A draw/layout pass normally completes in the next runloop drain.
(
    0   MyorgDevelopmentEG2             0x000000010bb2e335 -[GREYAppStateTrackerObject setState:] + 69
    1   MyorgDevelopmentEG2             0x000000010bb2d3e3 __133-[GREYAppStateTracker grey_changeState:usingOperation:forObject:orInternalObjectDeallocationTracker:orExternalAppStateTrackerObject:]_block_invoke + 931
    2   MyorgDevelopmentEG2             0x000000010bb2ca20 -[GREYAppStateTracker grey_performBlockInCriticalSection:] + 224
    3   MyorgDevelopmentEG2             0x000000010bb2cf64 -[GREYAppStateTracker grey_changeState:usingOperation:forObject:orInternalObjectDeallocationTracker:orExternalAppStateTrackerObject:] + 1076
    4   MyorgDevelopmentEG2             0x000000010bb2bbf6 -[GREYAppStateTracker trackState:forObject:] + 102
    5   MyorgDevelopmentEG2             0x000000010bb02b0d -[UIView(GREYApp) greyswizzled_setNeedsLayout] + 93
    6   UIKitCore                           0x00007fff24ba5675 -[UIScrollView setNeedsLayout] + 79
    7   UIKitCore                           0x00007fff23dc0390 -[UICollectionView _updateAnimationDidStop:finished:context:] + 2236
    8   UIKitCore                           0x00007fff23dbf9e4 __102-[UICollectionView _updateWithItems:tentativelyForReordering:propertyAnimator:collectionViewAnimator:]_block_invoke.2110 + 77
    9   MyorgDevelopmentEG2             0x000000010bb2fdef __60-[GREYDispatchQueueTracker grey_dispatchAsyncCallWithBlock:]_block_invoke + 47
    10  libdispatch.dylib                   0x00007fff2010670d _dispatch_call_block_and_release + 12
    11  libdispatch.dylib                   0x00007fff201078df _dispatch_client_callout + 8
    12  libdispatch.dylib                   0x00007fff20114a27 _dispatch_main_queue_callback_4CF + 1045
    13  CoreFoundation                      0x00007fff203908f8 __CFRUNLOOP_IS_SERVICING_THE_MAIN_DISPATCH_QUEUE__ + 9
    14  CoreFoundation                      0x00007fff2038b169 __CFRunLoopRun + 2781
    15  CoreFoundation                      0x00007fff2038a1a7 CFRunLoopRunSpecific + 567
    16  GraphicsServices                    0x00007fff2b874d85 GSEventRunModal + 139
    17  UIKitCore                           0x00007fff246c14df -[UIApplication _run] + 912
    18  UIKitCore                           0x00007fff246c639c UIApplicationMain + 101
    19  MyorgDevelopmentEG2             0x0000000108f175de main + 190
    20  libdyld.dylib                       0x00007fff2025abbd start + 1
    21  ???                                 0x0000000000000005 0x0 + 5
)
<_ASDisplayLayer: 0x600007996580> => Waiting for UIView's draw/layout pass to complete. A draw/layout pass normally completes in the next runloop drain.
Hypothesis
This leads me to think there are some orphaned subprocess or daemon that still holds onto to resources. Or there are artifacts not being clean up properly.
Things I have tried
- shutdown, erase, delete all simulator between builds (No Help)
    xcrun simctl shutdown all
    xcrun simctl erase all
    xcrun simctl delete all
    osascript -e 'tell application "iOS Simulator" to quit'
    osascript -e 'tell application "Simulator" to quit'
- Kill CoreSimulator related services between builds (No Help)
    launchctl remove com.apple.CoreSimulator.CoreSimulatorService || true
    launchctl remove com.apple.CoreSimulator.SimLaunchHost-x86 || true
    launchctl remove com.apple.CoreSimulator.SimulatorTrampoline || true
    launchctl remove com.apple.CoreSimulator.SimLaunchHost-arm64 || true
- delete simulator devices, logs, and cache between builds. This actually helped a bit. The flakiness went away initially but came back quickly after a few builds while the machines still performing the cleaning between builds....unsure why.
    echo "Delete all simulator devices, cache, and temp"
    rm -rf ~/Library/Developer/CoreSimulator

    echo "Delete Simulator Logs"
    rm -rf ~/Library/Logs/CoreSimulator
- Increase Animation Timeout, Interaction Timeout, on EarlGrey
- Blacklist the URL the request hung on. This did improve the stability of the test suite by ignoring the symptom and not fixing the actual probelm so I am hoping I can avoid this.
Anyone else running into the same issue? Appreciate if someone can shed any light on this or give suggestions to try.
Note: We uses Bluepill and EarlGrey2 to run UI tests (iOS 14.5, Xcode 12.5) on Buildkite CI pipeline.


DerivedDatadirectory between builds? – Elisabethelisabethvillerm -rf /app/build/path/to/DerivedDatabefore your next build to see if your results differ.DerivedDatais basically a cache of sorts which doesn't get cleared unless you clean that directory before each build. – Elisabethelisabethville