After upgrading to Spring Boot 3 I've had to update the tracing/correlation configuration to switch from Spring Cloud Sleuth to the new Micrometer Tracing library.
At this point I can see traceId/spanId information in the logs, which is correctly transmited to other services using HTTP calls with an automatically instrumented WebClient.
However, it seems that Spring Cloud Streams Kafka producers and consumers aren't being instrumented.
Here's an example of the producer:
logger.debug("Sending message to kafka queue {}", message)
streamBridge.send(bindingName, message)
Logs with the traceId,spanId:
[producer,638b36642e4fe0b203b7f32b746b22de,03b7f32b746b22de] 52233 --- [ctor-http-nio-3] i.s.m.p.p.ProjectTaskEventProducer       : Sending message to kafka queue GenericMessage [xxx]
[producer,638b36642e4fe0b203b7f32b746b22de,03b7f32b746b22de] 52233 --- [ctor-http-nio-3] o.s.c.s.binder.DefaultBinderFactory      : Creating binder: kafka
On the consumer side I have this simple KStream:
    @Bean
    fun processEvent() =
        Function<KStream<EventKey, EventValue>, KStream<EventKey, EventValue?>> { events ->
            events.process(
                ProcessorSupplier {
                    Processor<EventKey, EventValue, EventKey, EventValue> {
                        logger.info("{}", it.headers())
                    }
                }
            )
        }
Logs
[consumer,,] 52544 --- [-StreamThread-1] ventKStreamConfiguration$$SpringCGLIB$$0 : RecordHeaders(headers = [RecordHeader(key = target-protocol, value = [107, 97, 102, 107, 97]), RecordHeader(key = spring_json_header_types, value = [123, 34, 116, 97, 114, 103, 101, 116, 45, 112, 114, 111, 116, 111, 99, 111, 108, 34, 58, 34, 106, 97, 118, 97, 46, 108, 97, 110, 103, 46, 83, 116, 114, 105, 110, 103, 34, 125])], isReadOnly = false)
As you can see only two headers were transmited (target-protocol and spring_json_header_types), with the b3 header missing. Thus, MDC logs aren't being setup either.
The Micrometer documentation is very sparse regarding messaging instrumentation so it's not clear how to do it in the context of Spring Cloud Stream.
- Shouldn't
StreamBridge, likeWebClient, be automatically instrumented? - Same thing on the consumer side.
UPDATE 1:
I've added a ProducerMessageHandlerCustomizer as indicated, enabling observation for the underlying KafkaTemplate.
@Configuration
class KafkaProducerConfiguration {

    @Bean
    fun kafkaProducerObservationCustomizer () : ProducerMessageHandlerCustomizer<KafkaProducerMessageHandler<EventKey, EventValue>> {
        return ProducerMessageHandlerCustomizer<KafkaProducerMessageHandler<EventKey, EventValue>> {
                handler, destinationName ->
            handler.kafkaTemplate.setObservationEnabled(true)
        }
    }
}
When StreamBridge is invoked the execution ends up in the customizer that sets the observationEnabled property to true:
However, the consumer still gets only two headers:
If you compare the ObservationRegistry that correlates the logs for the HTTP calls:
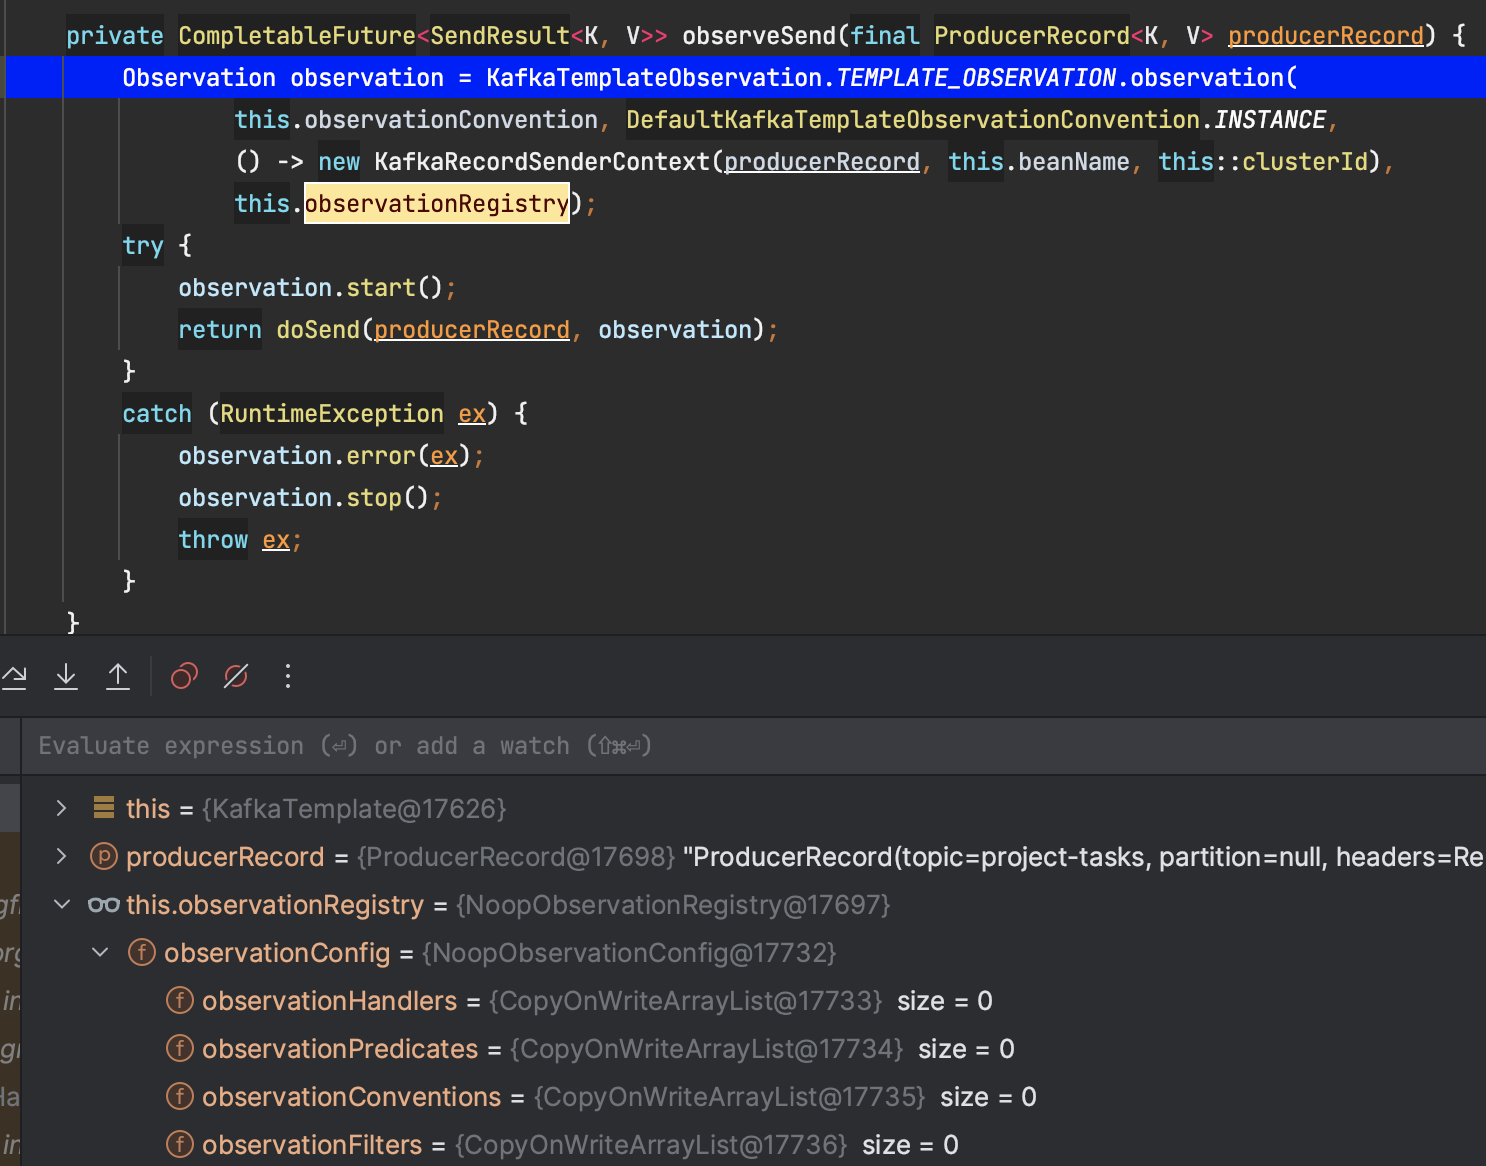
It is different from the one inside de KafkaTemplate:
The problem seems to be here in KafkaTemplate:
The observationRegistry is initialized during the application startup, when the ProducerMessageHandlerCustomizer hasn't been invoked yet. Thus, the value of observationEnabled will always be false, not executing the if block and defaulting to the NOOP registry:
private ObservationRegistry observationRegistry = ObservationRegistry.NOOP;
UPDATE 2:
I've tried this workaround
@Configuration
class KafkaProducerConfiguration {

    @Bean
    fun kafkaProducerObservationCustomizer (applicationContext: ApplicationContext, observationRegistry: ObservationRegistry) : ProducerMessageHandlerCustomizer<KafkaProducerMessageHandler<ClientProjectId, ProjectTaskEvent>> {
        return ProducerMessageHandlerCustomizer<KafkaProducerMessageHandler<ClientProjectId, ProjectTaskEvent>> {
                handler, destinationName ->
            handler.kafkaTemplate.setObservationEnabled(true)
            handler.kafkaTemplate.setApplicationContext(applicationContext)
            handler.kafkaTemplate.afterSingletonsInstantiated()
        }
    }
}
It doesn't work though. It seems to mess with the configuration of the producer, overriding its values. In my case it looks for a local Kafka cluster instead of the configured one:
2022-12-05T17:36:06.815+01:00  INFO [metrics-ingestor,,] 8056 --- [| adminclient-2] org.apache.kafka.clients.NetworkClient   : [AdminClient clientId=adminclient-2] Node -1 disconnected.
2022-12-05T17:36:06.816+01:00  WARN [metrics-ingestor,,] 8056 --- [| adminclient-2] org.apache.kafka.clients.NetworkClient   : [AdminClient clientId=adminclient-2] Connection to node -1 (localhost/127.0.0.1:9092) could not be established. Broker may not be available.


observationEnabled(true), the KafkaTemplate still references a Noop ObservationRegistry. I've detailed the problem in the UPDATE of the question. – Echovirus