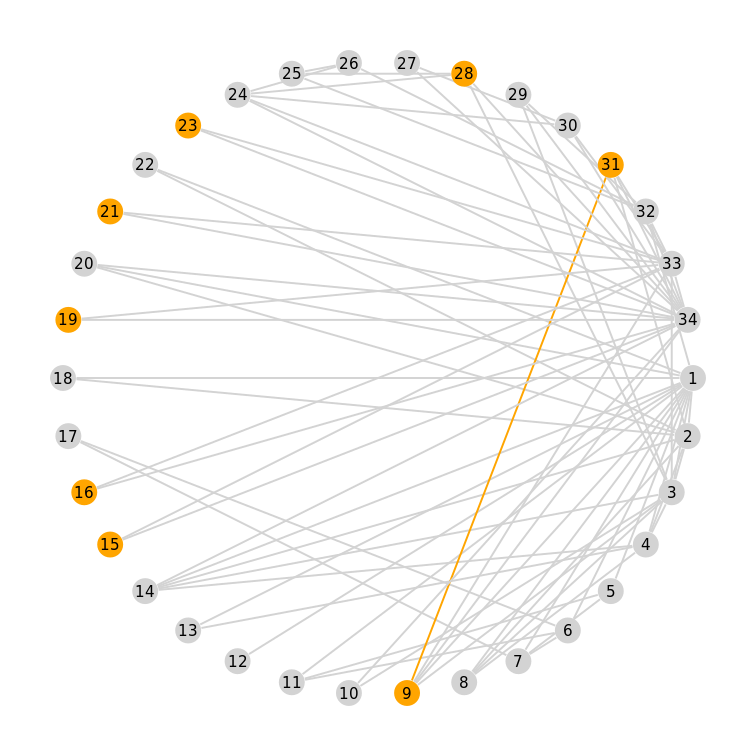
Here is a minimal working code from Julia Discourse:
using LightGraphs
using GraphPlot
using Colors

g = graphfamous("karate")

membership = [1,1,1,1,1,1,1,1,2,1,1,1,1,1,2,2,1,1,2,1,2,1,2,1,1,1,1,2,1,1,2,1,1,1]
nodelabels = 1:34
nodecolor = [colorant"lightgrey", colorant"orange"]
nodefillc = nodecolor[membership]

colors = [colorant"lightgray" for i in  1:78]
colors[42] = colorant"orange"

gplot(g, nodefillc=nodefillc, layout=circular_layout, edgestrokec=colors, nodelabel=nodelabels)
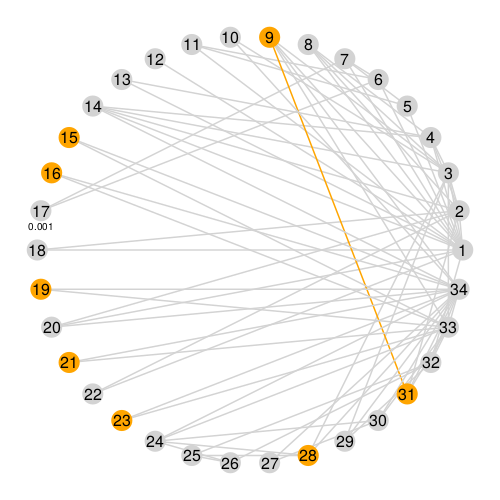
I succeed to have node labels, from 1 to 34, however, I need to display another type of labels for some specific nodes. e.g., the weight of some nodes. That is, I need, for instance, the weight of node 19 is 100 and the weight of node 1 is 0.001.
Is there a way to display such data? I could node find a relevant keyword in GraphPlot (only nodelabel only accepts a Vector) and I could not find another Julia package that could do it for plotting graphs.
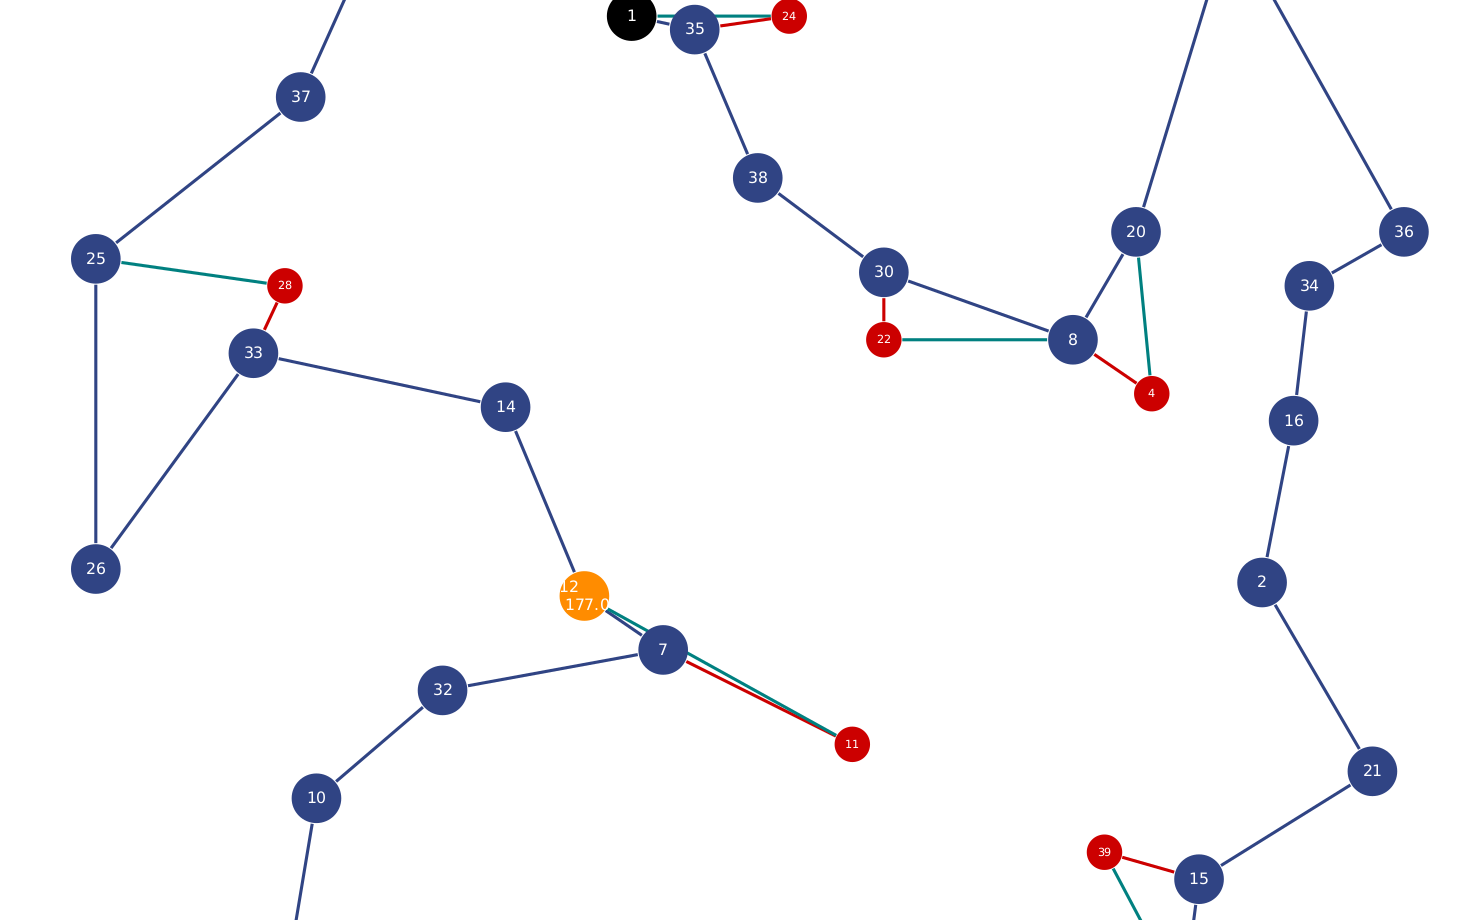
EDIT thanks to @Dan Getz, before posting on SE, I had the same idea as he suggested: try to label the nodes with a string of the format "$i\n $weight"
However, the result is highly unsatisfying as you can see in this picture of one of my actual graphs. Node 12 in Orange, separated from its weight 177.0 with \n is not really nice to read!
EDIT thanks to @Przemyslaw Szufel maybe my question could be resolved with Compose (that I actually already use) which is a graphic backend for GraphPlot. Unfortunately it is a bit undocumented despite I and other people asking about it!


nodelabelsto a vector of string including your extra annotation info? (i.e.nodelabels = ["$i $(weight[i])" for i=1:34]or something like this) – Tulleusing Composewhich is a graphic backend for GraphPlot. Unfortunately it is seems to be undocumented how to do it despite people were asking such thing. Perhaps you should reframe your question around Compose? – Satchel