Webpack source maps pointing to minified bundle
Asked Answered
H

2

6

I'm setting up a Webpack build process for an existing project and have been running into some issues with source maps.

I am using devtool: 'eval-source-map',. If an error happens in the browser, every file / line number in the stack trace points to a file condensed into a single line in the Webpack bundle.

For example, a first line of a stack trace might look like this:

Uncaught Error: foo

at child.initialize (eval at (http://127.0.0.1:8000/js/dist/index.js:1270:1), :45:10)

Clicking on the file name / line number brings me in the bundle to the line where the file where the error happened gets "included" by Webpack. Looks like this:

/* 223 */
/***/ (function(module, exports, __webpack_require__) {

"use strict";
// Below is the line it points to, and it goes on to have the entire file on the same line
eval("/* WEBPACK VAR INJECTION */(function(Backbone, $, _) { ... 

However the entire file content is on that single line, so this is completely useless.

This happens even if I trim my Webpack config down to just this:

var path = require('path'),
    webpack = require('webpack');

module.exports = {
    entry: {
        'indexhead': './static/js/main.js',
        'accounthead': './static/js/accountManager.js'
    },
    output: {
        path: path.join(__dirname, 'static/js/dist'),
        filename: '[name].js'
    },
    devtool: 'eval-source-map',
};

And happens for other types of development source map types outlined here. If instead I use the production setting of devtool: source-map, I still get pointed to a giant bundle file with every single script in there, but at least the lines are "unfurled" and I get to see where the error happened.

How can I fix this, or at least troubleshoot further?

Helton answered 12/6, 2017 at 21:26 Comment(2)
So you want it to direct you to the original js file instead of the output bundle when clicking on the filename:lineNumber in the console?Catechu
At the very least I want it to show me the line. Right now in dev it takes me to a single line that has the entirety of the original JS file so it's impossible to track the line number.Helton
E
2

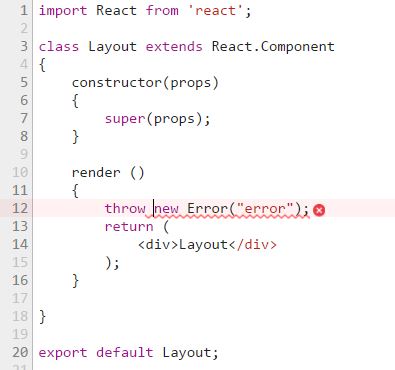
I did try to reproduce the problem and I found this. Maybe this is not where you looking for.

After bundling the code with webpack the code is throw a error in the Chrome console.

enter image description here

When I click on the main.js:2166 link, the browser is navigate me to the bundled code.

enter image description here

When I refresh the Chrome browser I see a link to the orginal file 'layout.js'.

enter image description here

Clicking on this link will bring me to the unbundled code.

enter image description here

If I build the webpage with Webpack with devtool: 'eval-source-map' I get the same result as with Webpack-dev-server. You can check if the build js files have an embedded sourceMap.

enter image description here

Equalitarian answered 17/6, 2017 at 18:7 Comment(2)
I'm afraid that I always have the same wrong output, no matter how many times I refresh the page (I am not using webpack-dev-server)Helton
Hi Alex, I did the test again with webpack build. Same result you have to refresh the Chrome browser to see the correct link. It's not working in FireFox. Check if there is an embedded source map in the compiled javascript file. Let me know if you need more help.Equalitarian
M
0

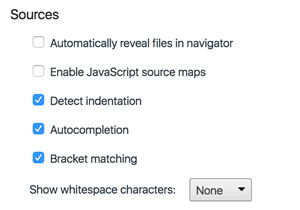
The only way I could replicate your issue is when I disabled source maps in Chrome settings:

enter image description here

I was getting something like this: enter image description here

When I enabled source maps, I got something like the image below. By clicking on the filename on the up right side, I was taken to the correct place.

enter image description here

Miler answered 22/6, 2017 at 6:36 Comment(0)

© 2022 - 2024 — McMap. All rights reserved.