I'm being trying to convert my plots to Seaborn and I'm having an issue with a multiple barplot that I have. The data is a list of lists, like so:
raw_data = [[47.66773437098896, 47.585408826566024, 45.426437828641106, 44.955787935926836],
           [47.700582993718115, 47.59796443553682, 45.38896827262796, 44.80916093973529],
           [47.66563311651776, 47.476571906259835, 45.21460968763448, 44.78683755963528],
           [47.248523637295705, 47.42573841363118, 45.52890109500238, 45.10243082784969],
           [47.14532745960979, 47.46958795222966, 45.4804195003332, 44.97715435208194],
           [46.61620129160194, 47.316775886868584, 45.053032014046366, 44.527497508033704]]
My simple seaborn script is as follows:
import numpy as np
import pandas as pd
import matplotlib.pyplot as plt
import seaborn as sns

def plot_sns(raw_data):
  data = np.array(raw_data)

  x = np.arange(len(raw_data))
  width = 0.2  # width of bar

  sns.axes_style('white')
  sns.set_style('white')

  ax = sns.barplot(x, data[:,0])
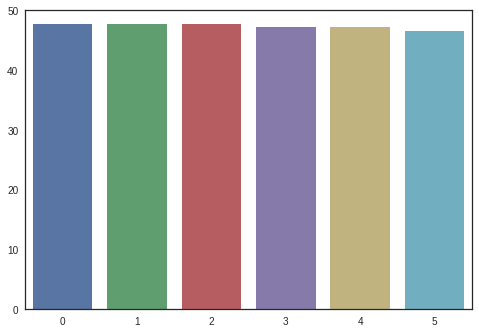
This yields the following plot:

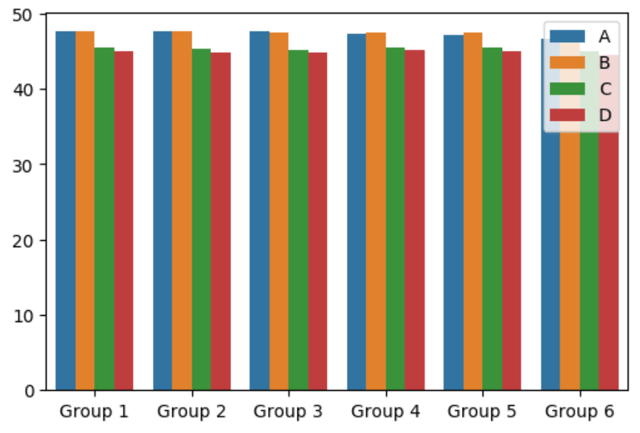
I would like to add more bars to the graph, side-by-side (4 bars per group). In Matplotlib, I do that by plotting another bar spaced to the right, but in Seaborn it didn't work. All the examples I saw used Pandas dataframes.


pd.DataFrame(raw_data).plot.bar()? – Chevrette