How to properly fit data to a power law in Python?
Asked Answered
R

2

6

I am considering the number of occurrence of unique words in the Moby Dick novel and using the powerlaw python package to fit words’ frequencies to a power law.

I am not sure why I can't recapitulate the results from previous work by Clauset et al. as both the p-value and the KS score are "bad".

The idea is to fit the frequencies of unique words into a power law. However, the Kolmogorov-Smirnov tests for goodness of fit calculated by scipy.stats.kstest look terrible.

I have the following function to fit data to a power law:

import numpy as np
import powerlaw
import scipy
from scipy import stats

def fit_x(x):
    fit = powerlaw.Fit(x, discrete=True)
    alpha = fit.power_law.alpha
    xmin  = fit.power_law.xmin
    print('powerlaw', scipy.stats.kstest(x, "powerlaw", args=(alpha, xmin), N=len(x)))
    print('lognorm', scipy.stats.kstest(x, "lognorm", args=(np.mean(x), np.std(x)), N=len(x)))

Downloading the frequency of unique words in the novel Moby Dick by Herman Melville (supposed to follow a power law according to Aaron Clauset et al.):

wget http://tuvalu.santafe.edu/~aaronc/powerlaws/data/words.txt

Python script:

x =  np.loadtxt('./words.txt')
fit_x(x)

results:

('powerlaw', KstestResult(statistic=0.862264651286131, pvalue=0.0))
('log norm', KstestResult(statistic=0.9910368602492707, pvalue=0.0))

When I compare the expected results and follow this R tutorial on the same Moby Dick dataset I get a decent p-value and KS test value:

library("poweRlaw")
data("moby", package="poweRlaw")
m_pl = displ$new(moby)
est = estimate_xmin(m_pl)
m_pl$setXmin(est)
bs_p = bootstrap_p(m_pl)
bs_p$p
## [1] 0.6738

What am I missing when computing the KS test values and postprocessing the fit by the powerlaw python library? The PDF and CDF look ok to me, but the KS tests look awry.

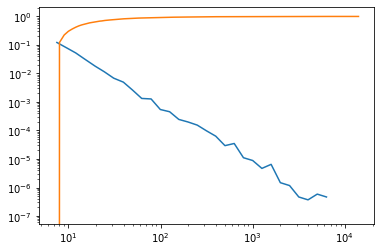
enter image description here

Ronna answered 4/8, 2019 at 22:47 Comment(8)
The Karate Club network is fairly small. I don't think you have enough samples in there to make very strong statistical statements.Cerebritis
Also, in my experience, people often use the term powerlaw fairly loosely to mean any distribution where the histogram counts on a log-log plot form a line for some range of the data, where the linear part rarely covers the whole range of the data. Hence when you run the KS-test, you might get a low score even for samples from the literature.Cerebritis
Final fun fact: a random subsample from a powerlaw distribution will not be distributed according to a powerlaw. Hence any claim in the literature that empirical distribution x follows a powerlaw is inherently wrong (the parent distribution must have much thicker tails than expected for a powerlaw distribution if the distribution of the subsample is to follow a powerlaw distribution).Cerebritis
@PaulBrodersen From the website the author linked to: arxiv.org/abs/0706.1062 "Power-law distributions in empirical data", the paper is talking about how "Commonly used methods for analyzing power-law data, such as least-squares fitting, can produce substantially inaccurate estimates of parameters for power-law distributions, and even in cases where such methods return accurate answers they are still unsatisfactory because they give no indication of whether the data obey a power law at all." However, I'm not sure what's happening with the results hereTreasonable
Here is a recent article from a reputable journal stating the result on power-law sampling. The result itself though is much older (and for some reason continuous to be not too well known).Cerebritis
I wasn't not trying to point to a solution to your fitting problem, I was just referencing the theorem (on page 2 of the pdf): "Power-laws or scale-free distributions, despite their name, are not invariant under subsampling. Namely, if P(s) follows a power-law distribution, then P_{sub}(s) is not a power law [...]" I think this theorem has important implications for the interpretation of many results published in the literature (quite damning, usually), and should caution you to over-interpret any scale-freeness you might think you might be observing in your own data.Cerebritis
To fit your scalar and exponent, I would plot the degree counts on a log-log plot and eyeball the parameters from the straight portion of the graph.Cerebritis
related: asaip.psu.edu/Articles/beware-the-kolmogorov-smirnov-testRonna
R
1

It is still not clear to me how to determine significance and goodness of fit by using the scipy.stats.kstest with the powerlaw library.

Though, powerlaw implements its own distribution_compare capability which returns the likelihood ratio R and the p-val of R (see some content from Aaron Clauset on here):

R : float Loglikelihood ratio of the two distributions' fit to the data. If greater than 0, the first distribution is preferred. If less than 0, the second distribution is preferred.

p : float Significance of R

from numpy import genfromtxt
import urllib
import powerlaw

urllib.urlretrieve('https://raw.github.com/jeffalstott/powerlaw/master/manuscript/words.txt', 'words.txt')
words = genfromtxt('words.txt')

fit = powerlaw.Fit(words, discrete=True)

print(fit.distribution_compare('power_law', 'exponential', normalized_ratio=True))
(9.135914718776998, 6.485614241379581e-20)
print(fit.distribution_compare('power_law', 'truncated_power_law'))
(-0.917123083373983, 0.1756268316869548)
print(fit.distribution_compare('power_law', 'truncated_power_law'))
(-0.917123083373983, 0.1756268316869548)
print(fit.distribution_compare('power_law', 'lognormal'))
(0.008785246720842022, 0.9492243713193919)
Ronna answered 26/9, 2021 at 7:50 Comment(0)
G
1

I think you should pay attention to whether the data is continuous or discrete, and then choose the appropriate test method; in addition, as the former said, the size of the data will have a certain impact on the result, I hope it will help you

Gymnastics answered 9/9, 2020 at 9:24 Comment(0)
R
1

It is still not clear to me how to determine significance and goodness of fit by using the scipy.stats.kstest with the powerlaw library.

Though, powerlaw implements its own distribution_compare capability which returns the likelihood ratio R and the p-val of R (see some content from Aaron Clauset on here):

R : float Loglikelihood ratio of the two distributions' fit to the data. If greater than 0, the first distribution is preferred. If less than 0, the second distribution is preferred.

p : float Significance of R

from numpy import genfromtxt
import urllib
import powerlaw

urllib.urlretrieve('https://raw.github.com/jeffalstott/powerlaw/master/manuscript/words.txt', 'words.txt')
words = genfromtxt('words.txt')

fit = powerlaw.Fit(words, discrete=True)

print(fit.distribution_compare('power_law', 'exponential', normalized_ratio=True))
(9.135914718776998, 6.485614241379581e-20)
print(fit.distribution_compare('power_law', 'truncated_power_law'))
(-0.917123083373983, 0.1756268316869548)
print(fit.distribution_compare('power_law', 'truncated_power_law'))
(-0.917123083373983, 0.1756268316869548)
print(fit.distribution_compare('power_law', 'lognormal'))
(0.008785246720842022, 0.9492243713193919)
Ronna answered 26/9, 2021 at 7:50 Comment(0)

© 2022 - 2024 — McMap. All rights reserved.