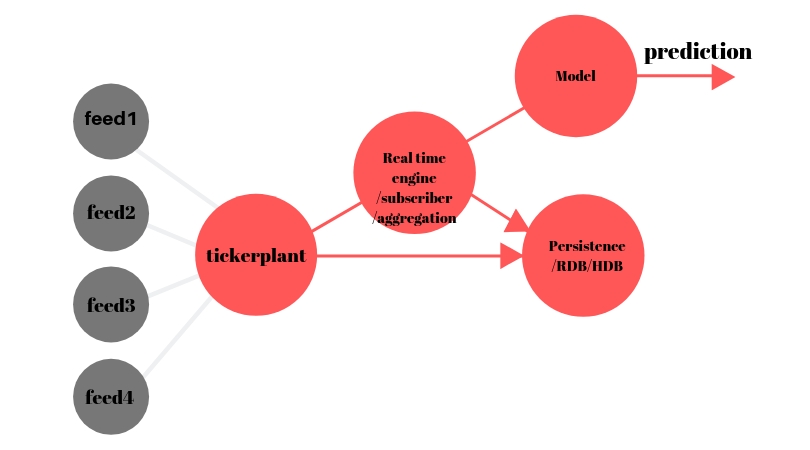
I am trying to implement an aggregation table that collates data from multiple disparate tables into one for feature engineering, preprocessing and normalization. I am facing numerous problems the first of which is that I have to somehow construct the schema for this aggregation table without hard coding it, this gives me sufficient flexibility with respect to adding additional data feeds.
trades
  - exch1
    - sym1
    - sym2
  - exch2
    - sym1
    - sym2
book
  - exch1
    - sym1
    - sym2
  - exch2
    - sym1
    - sym2
sentiment
   - sym1
   - sym2
The problem arises, as I have noted in previous questions when I want to insert new aggregations that may or may not have different schema's into the aggregation table (after aggregation) within the kdb-tick architecture.
I have noted the uj operation which seemed like an adequate operation seen as though the output rate will only be roughly 0.5-1 hertz, However I have been told that this can be seen as an anti-pattern on account of the fact that it may cause problems with persistence, is not an efficient operation etc.
I have thought of checking the schema before conducting an insert/upsert operation (If the schema is different, update the schema, then insert). However this might also be inefficient.
I have taken note of answers to previous questions however all seem to have negative points that may outweigh their positives.
The nature of the aggregation means that I only need a table of roughly 1000 rows on the RTE subscriber/worker in order to effectively run aggregations whereby older records will be purged to disk. However the number of columns could change intermittently (new feeds added etc.) not necessarily intra-day.
The nature of the data also means that aggregations need to be run continuously i.e. cutting of data into days would be inneffective.
I have also thought of maintaining a separate table for each new feature, however the number of tables would also cause inefficiency.
Issues also arise when one chooses to try send the old/purged aggregated rows to a worker that then persists those aggregations periodically, how does one modify the kdb-tick publisher-subscriber architecture to support .u.upd[] when the columns of the aggregated data might change?
The problem is not the kdb-tick architecture itself but how one might conduct aggregations on on the data therein whilst maintaining backwards schema compatibility/efficiency?
I have even contemplated creating my own domain specific database in Rust, partitioning the data into sharded flat-files. however have opted to stick with kdb/q on account of the superior query operations I would be able to conduct/create.
I think running aggregations like this online/in real time would be an important feature for the utilization of ml with kdb+, however I have not been able to find any documentation eluding to this.
My questions therefore can be summarized as follows: What is the canonical implementation of this? How does one effectively aggregate data from multiple sources as is depicted above in kdb? Your advice is truly appreciated.

