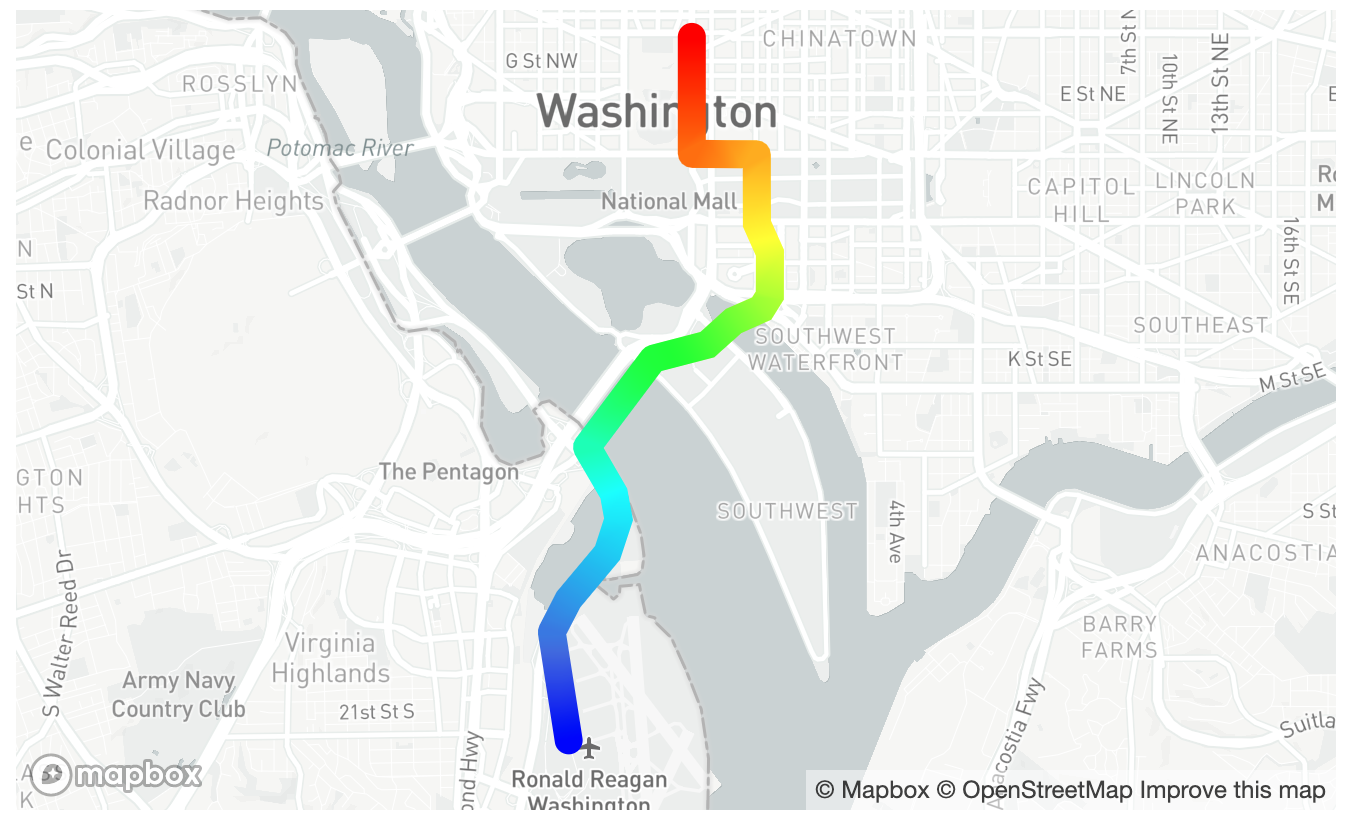
Mapbox multicolored polyline
Asked Answered
C

1

6

I'm moving my app over to Mapbox and one of the things that I'm stuck on is creating a multicolored polyline where the segment color is set dynamically by speed. The closest thing I've been able to do is create an array of different colored lines and add them to the map as many individual lines but the processing time and frame rate degradation it too much not to mention you can see the different segments. This is easily achievable with MapKit or Google Maps, but as far as I can tell a polyline can only have one color in Mapbox.

A very similar question was asked Here but that was 3 years ago and the answer seem to relate to using the directions API.

The basic function looks like this and I created a custom MGLMulticolorPolyline class so that I could set the color

    func locationPolyLine(locations : [Location], averageSpeed: Double, topSpeed: Double) -> [MGLMulticolorPolyline] {


    var coordinates: [(CLLocation, CLLocation)] = []
    var speeds: [Double] = []
    let smallerLocationArray = locations.enumerated().filter({ index, _ in
        index % 2 != 0
    }).map { $0.1 }


    for (first, second) in zip(smallerLocationArray, smallerLocationArray.dropFirst()) {
        //create an array of coordinates
        let start = CLLocation(latitude: first.locLatitude, longitude: first.locLongitude)
        let end = CLLocation(latitude: second.locLatitude, longitude: second.locLongitude)
        coordinates.append((start, end))


        let distance = end.distance(from: start)
        guard let firstTimestamp = first.locTimestamp,
            let secondTimestamp = second.locTimestamp else {continue}
        let time = secondTimestamp.timeIntervalSince(firstTimestamp as Date)
        let speed = time > 0 ? distance / time : 0
        speeds.append(speed)

    }


    var segments: [MGLMulticolorPolyline] = []
    var index = 0
    for ((start, end), speed) in zip(coordinates, speeds) {
        let coords = [start.coordinate, end.coordinate]
        let segment = MGLMulticolorPolyline(coordinates: coords, count: 2)

        if smallerLocationArray[index].lift == true{
            segment.color = UIColor.blue
        } else{
            segment.color = segmentColor(speed: speed,
                                         midSpeed: averageSpeed,
                                         slowestSpeed: 0.0,
                                         fastestSpeed: topSpeed)
        }
        segments.append(segment)

        index += 1
    }
    return segments

}
}

and it get added to the map like so

    let multiColoredPolyline = MapboxHelper().locationPolyLine(locations: locationsArray, averageSpeed: avgSpeed, topSpeed: maxSpeed)
    mapView.addAnnotations(multiColoredPolyline)
Contend answered 27/10, 2019 at 19:14 Comment(1)
Did you ever solve this issue? I'd like to do the same...Monotint
H
2

A little bit back, Mapbox introduced the line-gradient property.

https://docs.mapbox.com/mapbox-gl-js/example/line-gradient/ gives an example of how to use it.

enter image description here

<!DOCTYPE html>
<html>
<head>
<meta charset="utf-8">
<title>Create a gradient line using an expression</title>
<meta name="viewport" content="initial-scale=1,maximum-scale=1,user-scalable=no">
<link href="https://api.mapbox.com/mapbox-gl-js/v2.3.0/mapbox-gl.css" rel="stylesheet">
<script src="https://api.mapbox.com/mapbox-gl-js/v2.3.0/mapbox-gl.js"></script>
<style>
body { margin: 0; padding: 0; }
#map { position: absolute; top: 0; bottom: 0; width: 100%; }
</style>
</head>
<body>
<div id="map"></div>

<script>
    // TO MAKE THE MAP APPEAR YOU MUST
    // ADD YOUR ACCESS TOKEN FROM
    // https://account.mapbox.com
    mapboxgl.accessToken = '<your access token here>';
    var map = (window.map = new mapboxgl.Map({
        container: 'map',
        style: 'mapbox://styles/mapbox/light-v10',
        center: [-77.035, 38.875],
        zoom: 12
    }));

    var geojson = {
        'type': 'FeatureCollection',
        'features': [
            {
                'type': 'Feature',
                'properties': {},
                'geometry': {
                    'coordinates': [
                        [-77.044211, 38.852924],
                        [-77.045659, 38.860158],
                        [-77.044232, 38.862326],
                        [-77.040879, 38.865454],
                        [-77.039936, 38.867698],
                        [-77.040338, 38.86943],
                        [-77.04264, 38.872528],
                        [-77.03696, 38.878424],
                        [-77.032309, 38.87937],
                        [-77.030056, 38.880945],
                        [-77.027645, 38.881779],
                        [-77.026946, 38.882645],
                        [-77.026942, 38.885502],
                        [-77.028054, 38.887449],
                        [-77.02806, 38.892088],
                        [-77.03364, 38.892108],
                        [-77.033643, 38.899926]
                    ],
                    'type': 'LineString'
                }
            }
        ]
    };

    map.on('load', function () {
        // 'line-gradient' can only be used with GeoJSON sources
        // and the source must have the 'lineMetrics' option set to true
        map.addSource('line', {
            type: 'geojson',
            lineMetrics: true,
            data: geojson
        });

        // the layer must be of type 'line'
        map.addLayer({
            type: 'line',
            source: 'line',
            id: 'line',
            paint: {
                'line-color': 'red',
                'line-width': 14,
                // 'line-gradient' must be specified using an expression
                // with the special 'line-progress' property
                'line-gradient': [
                    'interpolate',
                    ['linear'],
                    ['line-progress'],
                    0,
                    'blue',
                    0.1,
                    'royalblue',
                    0.3,
                    'cyan',
                    0.5,
                    'lime',
                    0.7,
                    'yellow',
                    1,
                    'red'
                ]
            },
            layout: {
                'line-cap': 'round',
                'line-join': 'round'
            }
        });
    });
</script>

</body>
</html>

There's also a pathgradient lib which is documented at https://docs.mapbox.com/help/tutorials/add-gradient-route-line-video/.

It's a little hard to see in the code, and they don't explain it at all in the docu, but line https://github.com/mapbox/path-gradients/blob/master/main.js#L22 is where you would set whatever color you wanted, so instead of choosing a color which is dependent on the position of the ith element, you'd set the color based on the speed of the ith element.

Hicks answered 10/6, 2021 at 22:52 Comment(0)

© 2022 - 2024 — McMap. All rights reserved.