I have a set of logs like this:
{"action": "action_a", "username": "user_1", "ts": "2021-09-10T02:18:14.103Z"}
{"action": "action_a", "username": "user_2", "ts": "2021-09-10T02:17:14.103Z"}
{"action": "action_a", "username": "user_1", "ts": "2021-09-09T02:16:14.103Z"}
{"action": "action_a", "username": "user_1", "ts": "2021-09-08T02:15:14.103Z"}
Is it possible to group the logs by date and username to get a count of unique users per day?
I currently have the following query:
sum by (username) (count_over_time({job="my-app"} | json | username != "" [$__range]))
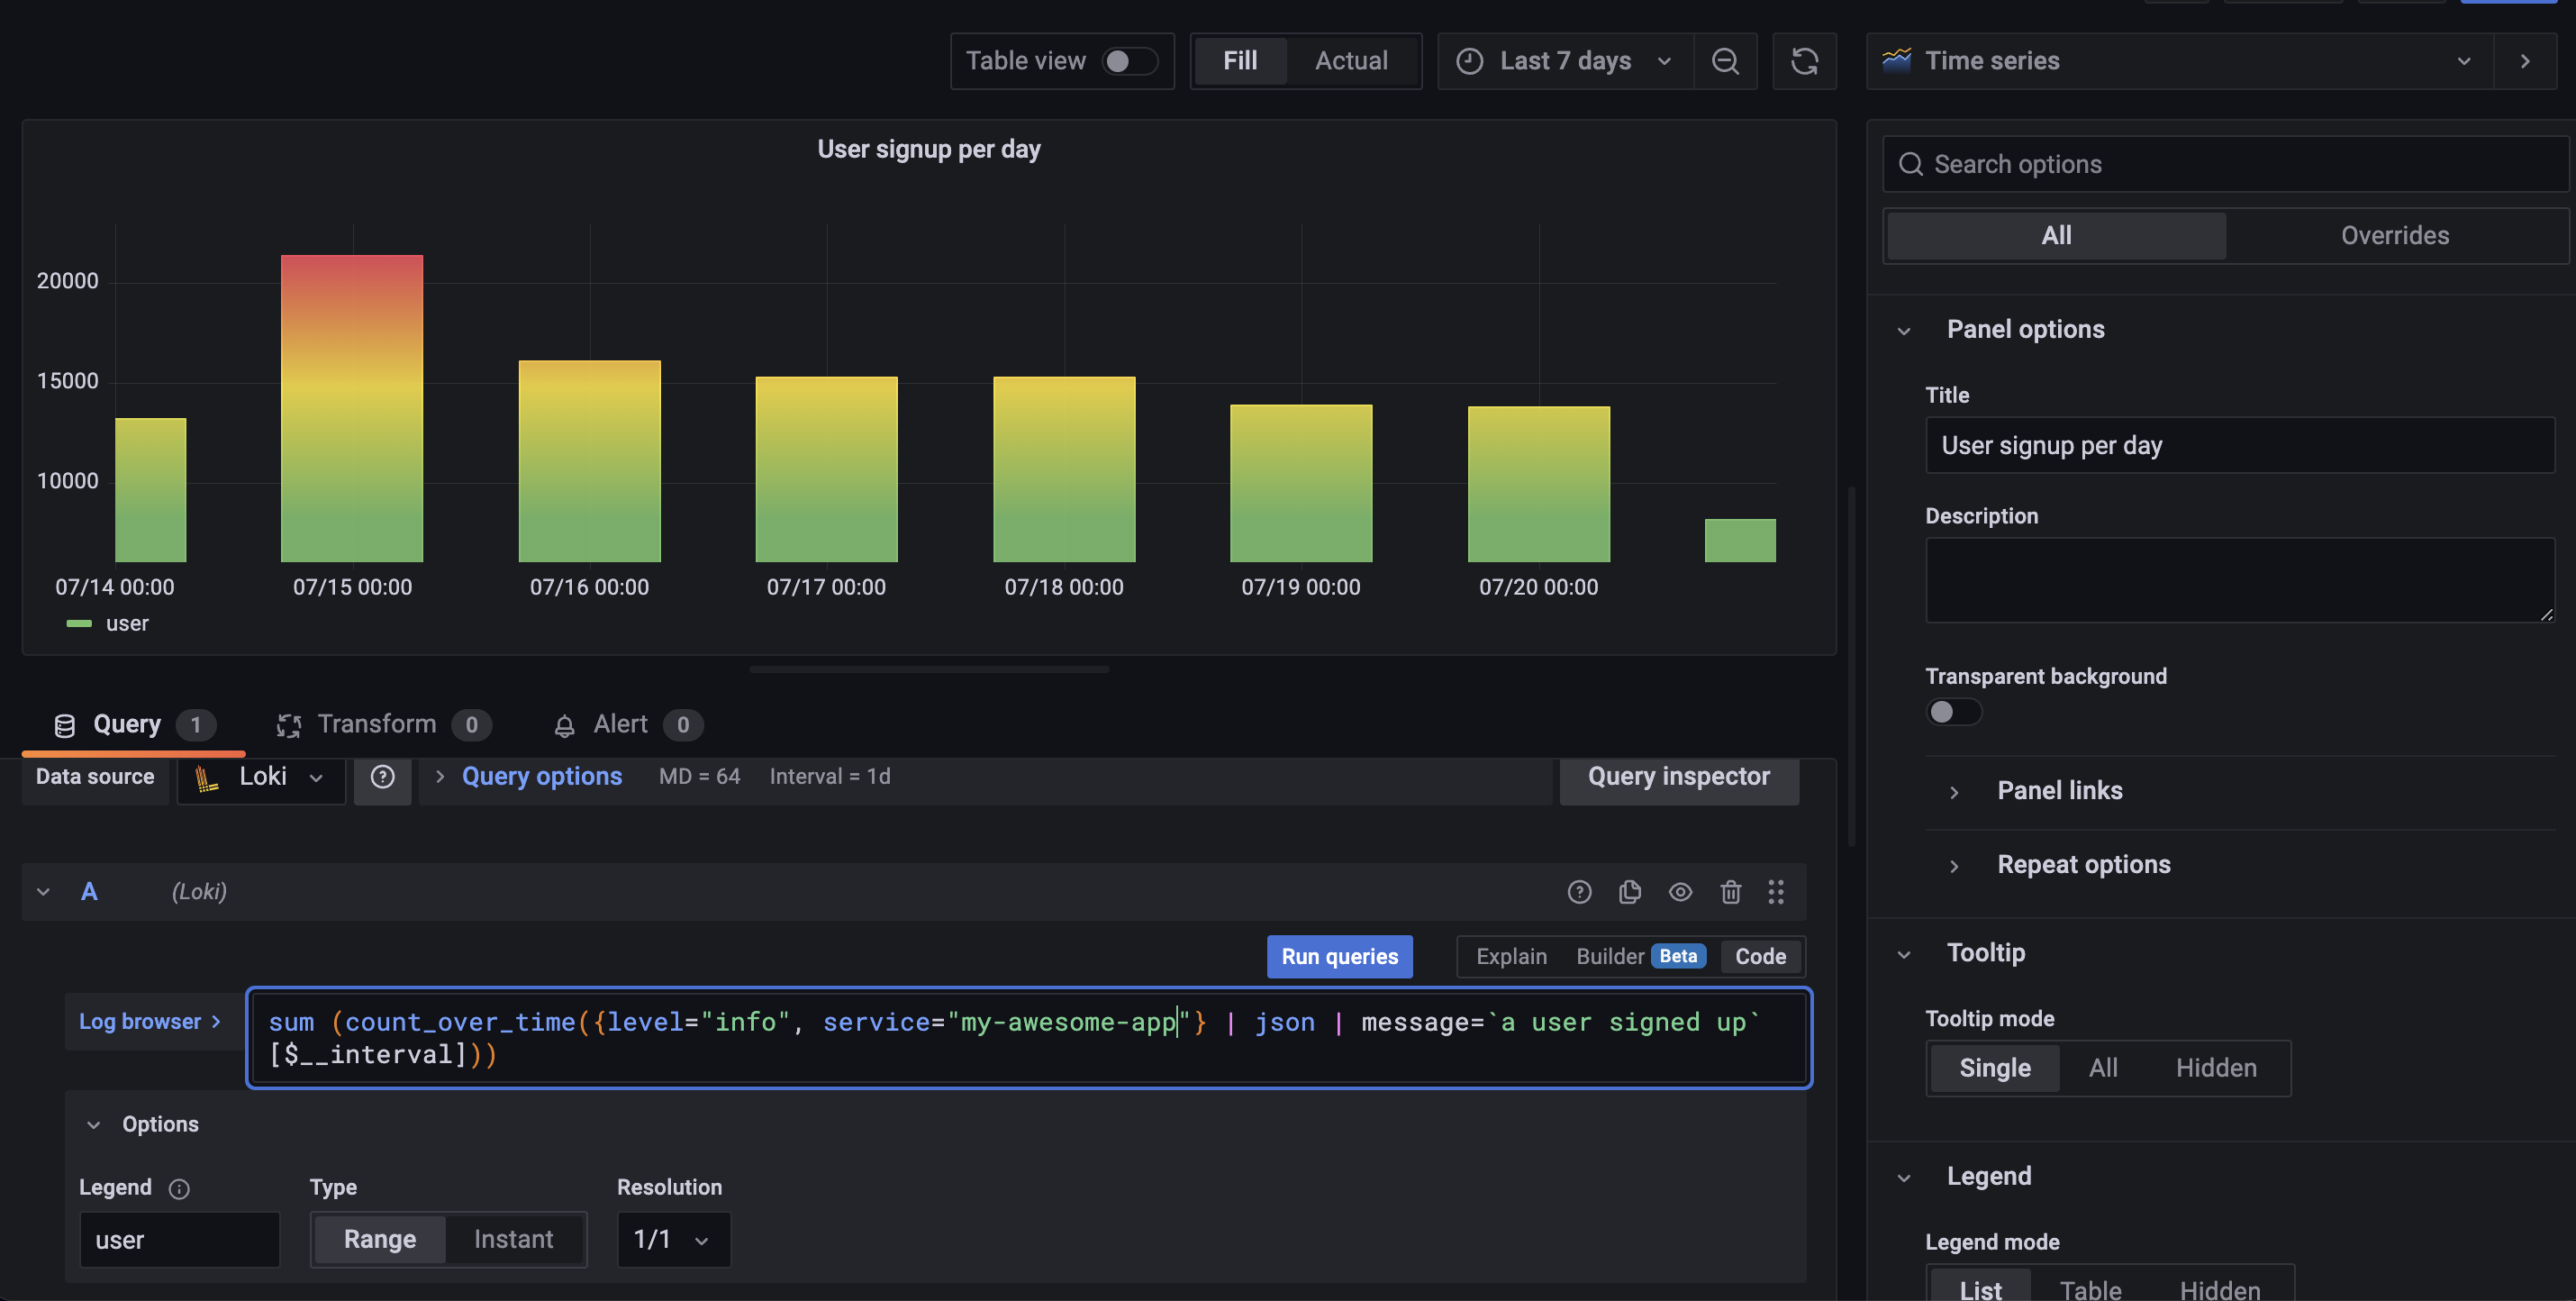
This effectively gives me a pie chart of unique users for the current dashboard range. Instead, I would like a time-series to show the number of unique users per day (for the past 60 days, for example). In other words, the Daily Active Users (DAU).
With the above logs, I need something like:
{"2021-09-10": 2}
{"2021-09-09": 1}
{"2021-09-08": 1}
Is this possible with Loki or should I look to something like Elasticsearch instead?

