how to generate a random convex piecewise-linear function
Asked Answered
N

2

6

I want to generate a toy example to illustrate a convex piecewise linear function in python, but I couldn't figure out the best way to do this. What I want to do is to indicate the number of lines and generate the function randomly.

A convex piecewise-linear function is defined as:

1

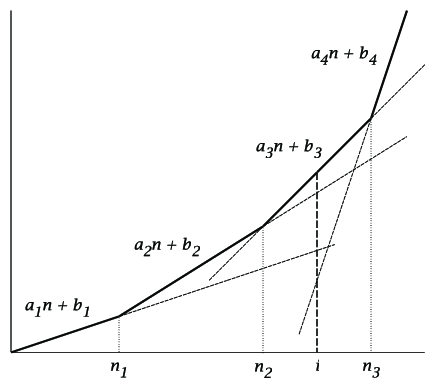
For instance, if I want to have four linear lines, then I want to generate something as shown below.

enter image description here

Since there are four lines. I need to generate four increasing random integers to determine the intervals in x-axis.

import random 
import numpy as np
random.seed(1)

x_points = np.array(random.sample(range(1, 20), 4))
x_points.sort()
x_points = np.append(0, x_points)

x_points
[0 3 4 5 9]

I can now use the first two points and create a random linear function, but I don't know how I should continue from there to preserve the convexity. Note that a function is called convex if the line segment between any two points on the graph of the function does not lie below the graph between the two points.

Nusku answered 26/12, 2021 at 19:46 Comment(3)
The slope needs to increase for each segment.Gristmill
@Gristmill I believe there should be some other rules too to make sure that pieces are connected.Nusku
That the pieces are connected is the rule. If you have the x intervals and the slopes, this defines all segments.Gristmill
L
2

The slope increases monotonically by a random value from the range [0,1), starting from 0. The first y value is also zero, see the comments.

import numpy as np
np.random.seed(0)

x_points = np.random.randint(low=1, high=20, size=4)
x_points.sort()
x_points = np.append(0, x_points)  # the first 0 point is 0

slopes = np.add.accumulate(np.random.random(size=3))
slopes = np.append(0,slopes)  # the first slope is 0

y_incr = np.ediff1d(x_points)*slopes
y_points = np.add.accumulate(y_incr)
y_points = np.append(0,y_points)  # the first y values is 0

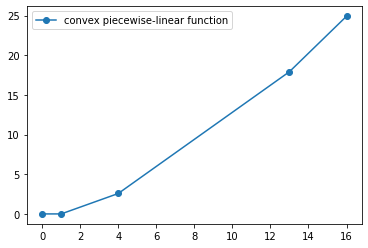
A possible output looks like this:

print(x_points)
print(y_points)
# [ 0  1  4 13 16]
# [ 0.          0.          2.57383685 17.92061306 24.90689622]

enter image description here

To print this figure:

import matplotlib.pyplot as plt
fig, ax = plt.subplots()
ax.plot(x_points,y_points, '-o', label="convex piecewise-linear function")
ax.legend()
fig.patch.set_facecolor('white')
plt.show()
Lynnelynnea answered 27/12, 2021 at 15:47 Comment(7)
Thanks for the great explanation. If I generate a random x point and would like to get the corresponding y value, how can I achieve it in your example? Also, could you kindly share the code that you used to plot the graph? ThanksNusku
See the last paragraph for the update on the graph. The code doesn't generate the points 1 by 1, but in a vectorized way for the whole range. If you need more points, it is the easiest to rerun the whole program with different settings requesting for more points.Lynnelynnea
I'm analyzing the code and realized that based on your code, the first linear function is always zero function. I guess you should generate four points for slope rather than appending zero.Nusku
You are right, it is 0, intentionally, just as the first x_point and the first y_point. Should you prefer non-0 first slope, generate 4 random values instead of 3 and remove the append 0 part.Lynnelynnea
Could you add the plotting code in your post in a proper way, please? I'm receiving an error when I try it on my side.Nusku
It was not python. Gnuplot is a great plotting program, works well with latex. I replaced the figure with the output from matplotlib, using python.Lynnelynnea
Thanks for all the help. It was a great help to me!Nusku
H
0

make sure the gradient (=dx/dy) is increasing. Pseudocode:

s = 1;
x = 0;
y = 0;
n = 4;
while(--n>0)
{
  //increase x randomly
  dx = rand(3);
  dy = dx * s;
  x += dx;
  y += dy; 
  //increase gradient randomly
  s += rand(3);
  print x + "/" +y;
}
Hypolimnion answered 26/12, 2021 at 20:9 Comment(0)

© 2022 - 2024 — McMap. All rights reserved.