What is difference between xgboost.plot_importance() and model.feature_importances_ in XGBclassifier.
so here I make some dummy data
import numpy as np
import pandas as pd
# generate some random data for demonstration purpose, use your original dataset here
X = np.random.rand(1000,100)     # 1000 x 100 data
y = np.random.rand(1000).round() # 0, 1 labels
a = pd.DataFrame(X)
a.columns = ['param'+str(i+1) for i in range(len(a.columns))]
b = pd.DataFrame(y)

import xgboost as xgb
from xgboost import XGBClassifier
from xgboost import plot_importance
from matplotlib import pyplot as plt
from sklearn.model_selection import train_test_split

model = XGBClassifier()
model.fit(a,b)

# Feature importance
model.feature_importances_

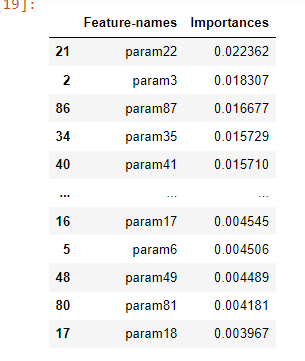
fi = pd.DataFrame({'Feature-names':a.columns,'Importances':model.feature_importances_})
fi.sort_values(by='Importances',ascending=False)


plt.bar(range(len(model.feature_importances_)),model.feature_importances_)
plt.show()

plt.rcParams.update({'figure.figsize':(20.0,180.0)})
plt.rcParams.update({'font.size':20.0})
plt.barh(a.columns,model.feature_importances_)

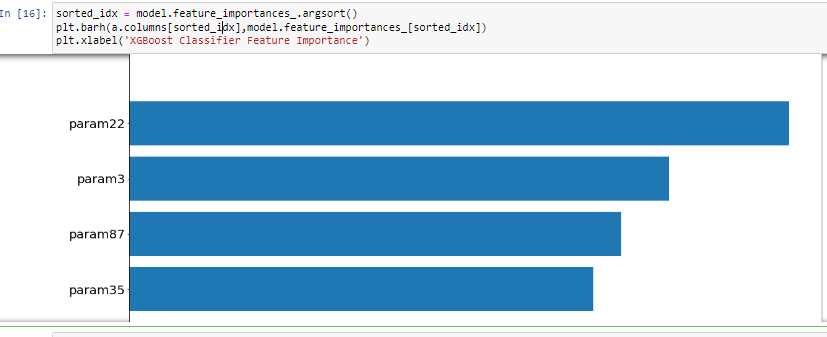
sorted_idx = model.feature_importances_.argsort()
plt.barh(a.columns[sorted_idx],model.feature_importances_[sorted_idx])
plt.xlabel('XGBoost Classifier Feature Importance')

#plot_importance
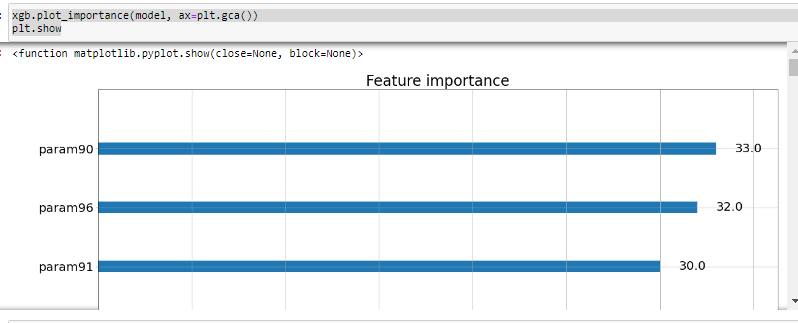
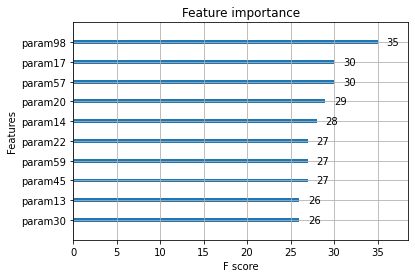
xgb.plot_importance(model, ax=plt.gca())
plt.show
if you see the graph, the feature importance and plot importance do not give the same result. I try to read the documentation but I do not understand in the layman's terms so does anyone understand why plot importance does not give results equal to plot importance?
if I do this
fi['Importances'].sum()
I got 1.0, which means that feature importance is the percentage.
if I want to do dimensionality reduction, which feature i should use? the one that comes from feature importance or plot importance?


plot_importanceplots the raw values, while thefeature_importances_provides percentages of the total (i.e. they sum to one) – Secern