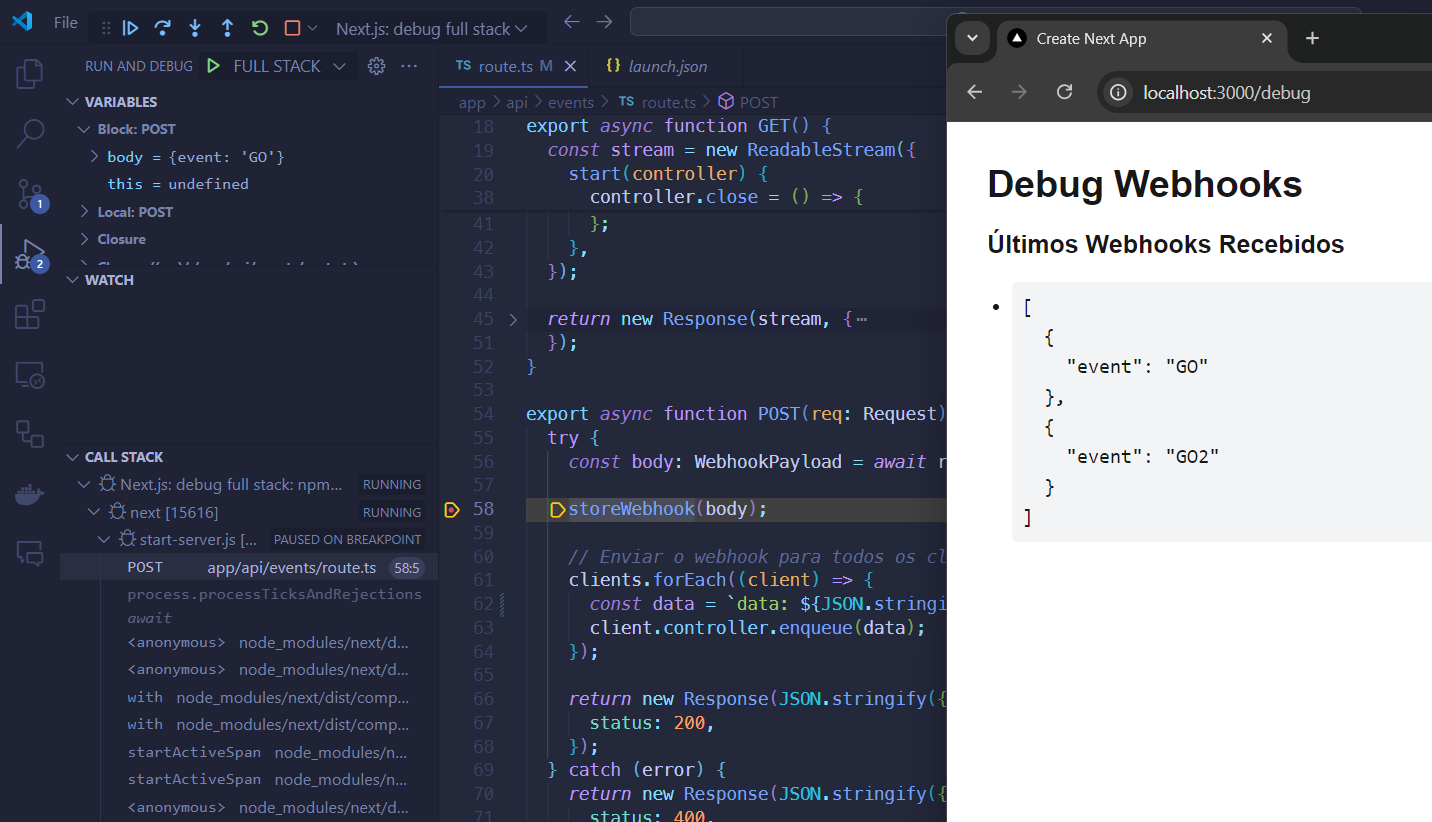
From the Next.js VSCode debugging page, I got the following launch.json.
{
  "configurations": [
    {
      "name": "Next.js: debug server-side",
      "type": "node-terminal",
      "request": "launch",
      "command": "npm run dev"
    },
    {
      "name": "Next.js: debug client-side",
      "type": "chrome",
      "request": "launch",
      "url": "http://localhost:3000"
    },
    {
      "name": "Next.js: debug full stack",
      "type": "node-terminal",
      "request": "launch",
      "command": "npm run dev",
      "serverReadyAction": {
        "pattern": "- Local:.+(https?://.+)",
        "uriFormat": "%s",
        "action": "debugWithChrome"
      }
    }
  ]
}
After running the full stack option, Next.js starts like any old npm run dev. The problem is that the debugging isn't very useful. In my debug terminal I have it selected so that there are breakpoints on caught exceptions. In Python applications (where my debugging experience lies), VSCode pauses on the exact line number whenever there is an exception and gives a useful, understandable error.
With Next.js, the breakpoint gives me a complicated, general error that leads to some random Next.js source code. This has next to no meaning for me.
For example, I got a promise rejected error. This is likely from a request I made that was handled with .catch using Axios. Next.js pointed me to the following deeply nested file.
\node_modules\next\dist\server\dev\on-demand-entry-handler.js
On line 202 it caught an error in code which I have never seen before. Upon unpausing the breakpoint, it leads to more of these errors.
How can I make Next.js debug for me more efficiently? I want more clear, understandable errors, that lead me to specific lines of code that I actually wrote.


