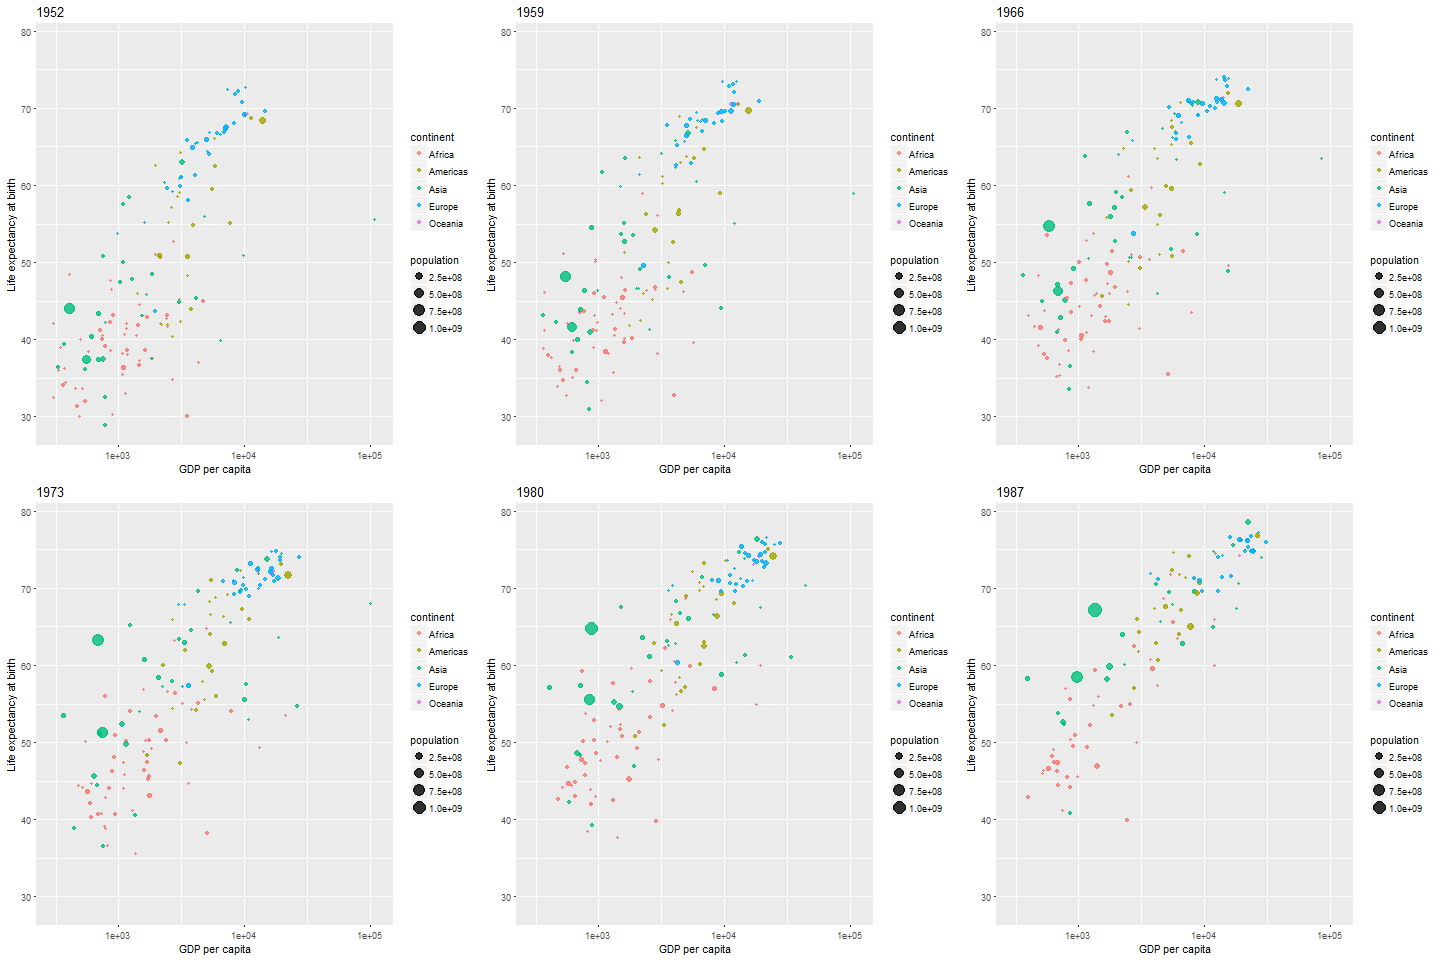
I am trying to add a year title to plot from a data set that has been run through tweenr. Following the example from revolutionanalytics.com
library(tidyverse)
library(tweenr)
library(gapminder)

gapminder_edit <- gapminder %>%
  arrange(country, year) %>%
  select(gdpPercap,lifeExp,year,country, continent, pop) %>%
  rename(x=gdpPercap,y=lifeExp,time=year,id=country) %>%
  mutate(ease="linear")

gapminder_tween <- tween_elements(gapminder_edit,
                              "time", "id", "ease", nframes = 150) %>%
  mutate(year = round(time), country = .group) %>%
  left_join(gapminder, by=c("country","year","continent")) %>%
  rename(population = pop.x)

gapminder_tween %>% arrange(country, .frame) %>% head()
#          x        y     time continent population .frame      .group year     country lifeExp   pop.y gdpPercap
# 1 779.4453 28.80100 1952.000      Asia    8425333      0 Afghanistan 1952 Afghanistan  28.801 8425333  779.4453
# 2 781.7457 28.88606 1952.278      Asia    8470644      1 Afghanistan 1952 Afghanistan  28.801 8425333  779.4453
# 3 784.0462 28.97111 1952.556      Asia    8515955      2 Afghanistan 1953 Afghanistan      NA      NA        NA
# 4 786.3466 29.05617 1952.833      Asia    8561267      3 Afghanistan 1953 Afghanistan      NA      NA        NA
# 5 788.6470 29.14122 1953.111      Asia    8606578      4 Afghanistan 1953 Afghanistan      NA      NA        NA
# 6 790.9475 29.22628 1953.389      Asia    8651889      5 Afghanistan 1953 Afghanistan      NA      NA        NA
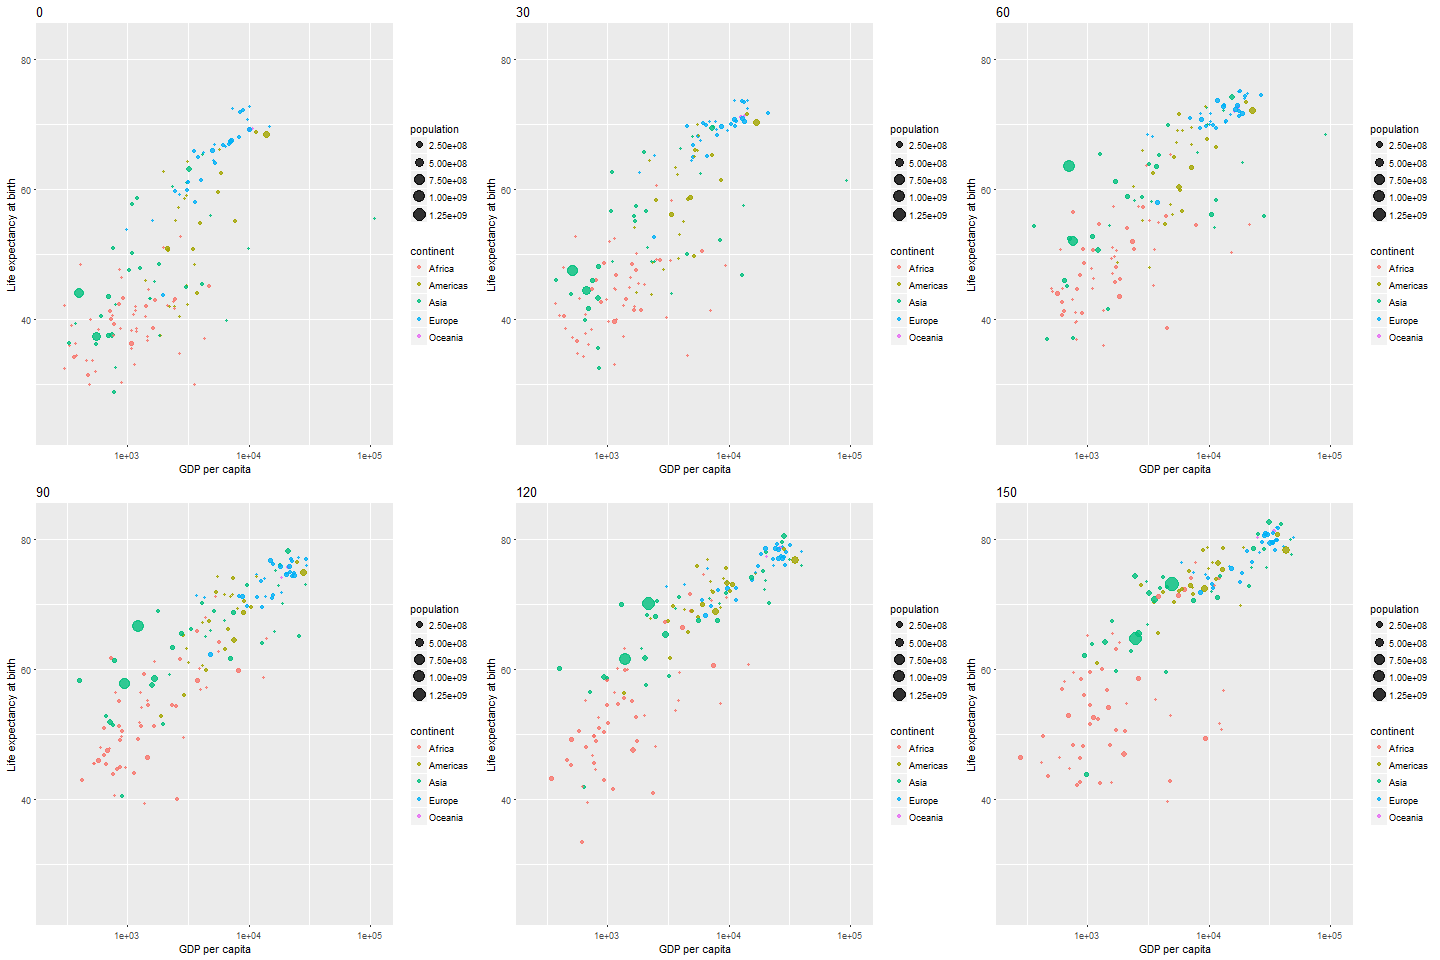
To create the gif I can use the frame titles (a bit meaningless) and set title_frame = TRUE (default) in the gganimate function..
library(gganimate)
library(animation)
p2 <- ggplot(gapminder_tween,
             aes(x=x, y=y, frame = .frame)) +
  geom_point(aes(size=population, color=continent),alpha=0.8) +
  xlab("GDP per capita") +
  ylab("Life expectancy at birth") +
  scale_x_log10()

magickPath <- shortPathName("C:\\Program Files\\ImageMagick-7.0.6-Q16\\magick.exe")
gganimate(p2, ani.options = ani.options(convert=magickPath), interval = 0.1)
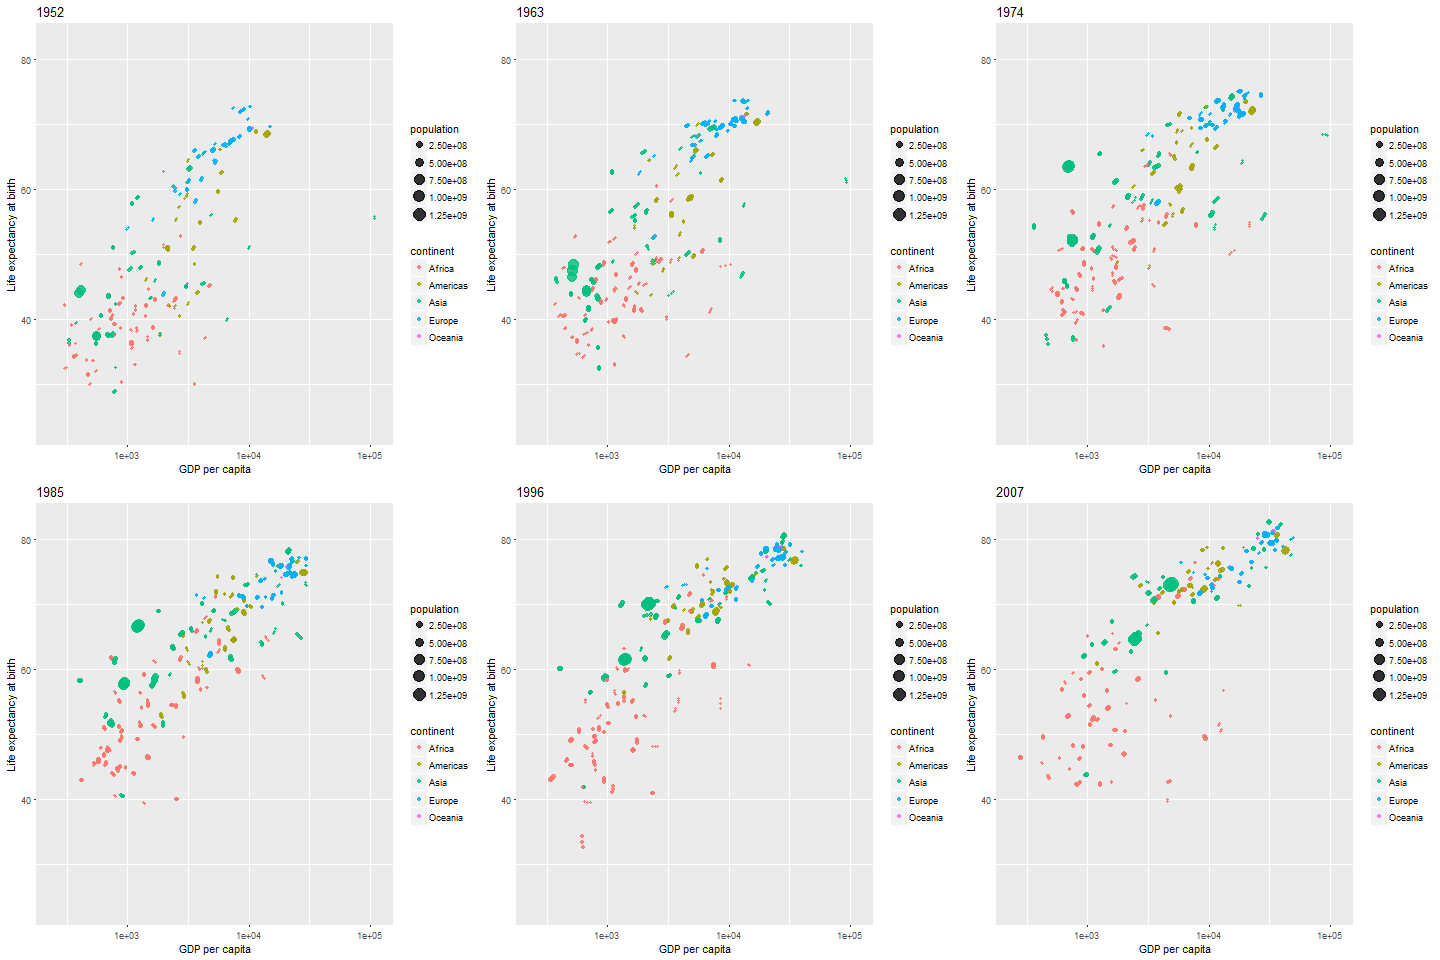
I tried to use the year column (frame = year in the mapping aesthetics), but this only produces 56 frames and points appearing multiple times in each frame..
p2 <- ggplot(gapminder_tween,
             aes(x=x, y=y, frame = year)) +
  geom_point(aes(size=population, color=continent),alpha=0.8) +
  xlab("GDP per capita") +
  ylab("Life expectancy at birth") +
  scale_x_log10()
Can I (and if so, how) have the first gif with titles for each frame corresponding to the corresponding values of year in the tween'ed data frame?


