Unpredictable API requests latency spikes in my ASP.NET Web API published to Azure Web App
Asked Answered
Z

2

6

We have a production system which is an ASP.NET Web API (classic, not .NET Core) application published to Azure. Data storage is Azure SQL Database and we use Entity Framework to access the data. API has a medium load, 10-60 requests per second and upper_90 latency is 100-200 ms which is a target latency is our case. Some time ago we noticed that approximately every 20-30 minutes our services stalls and latency jumps to approximately 5-10 sec. All requests start to be slow for about a minute and then the system recovers by itself. Same time no requests are being dropped, they all just take longer to execute. for a short period of time (usually 1 minute).

We start to see the following picture at our HTTP requests telemetry (Azure):

web app latency

We can also see a correlation to with our Azure SQL Database metrics, such as DTU (drop) and connections (increase):

db dtu and connections

We've analyzed the server and didn't see any correlation with the host (we have just one host) CPU/Memory usage, it's stable at 20-30% CPU usage level and 50% memory usage.

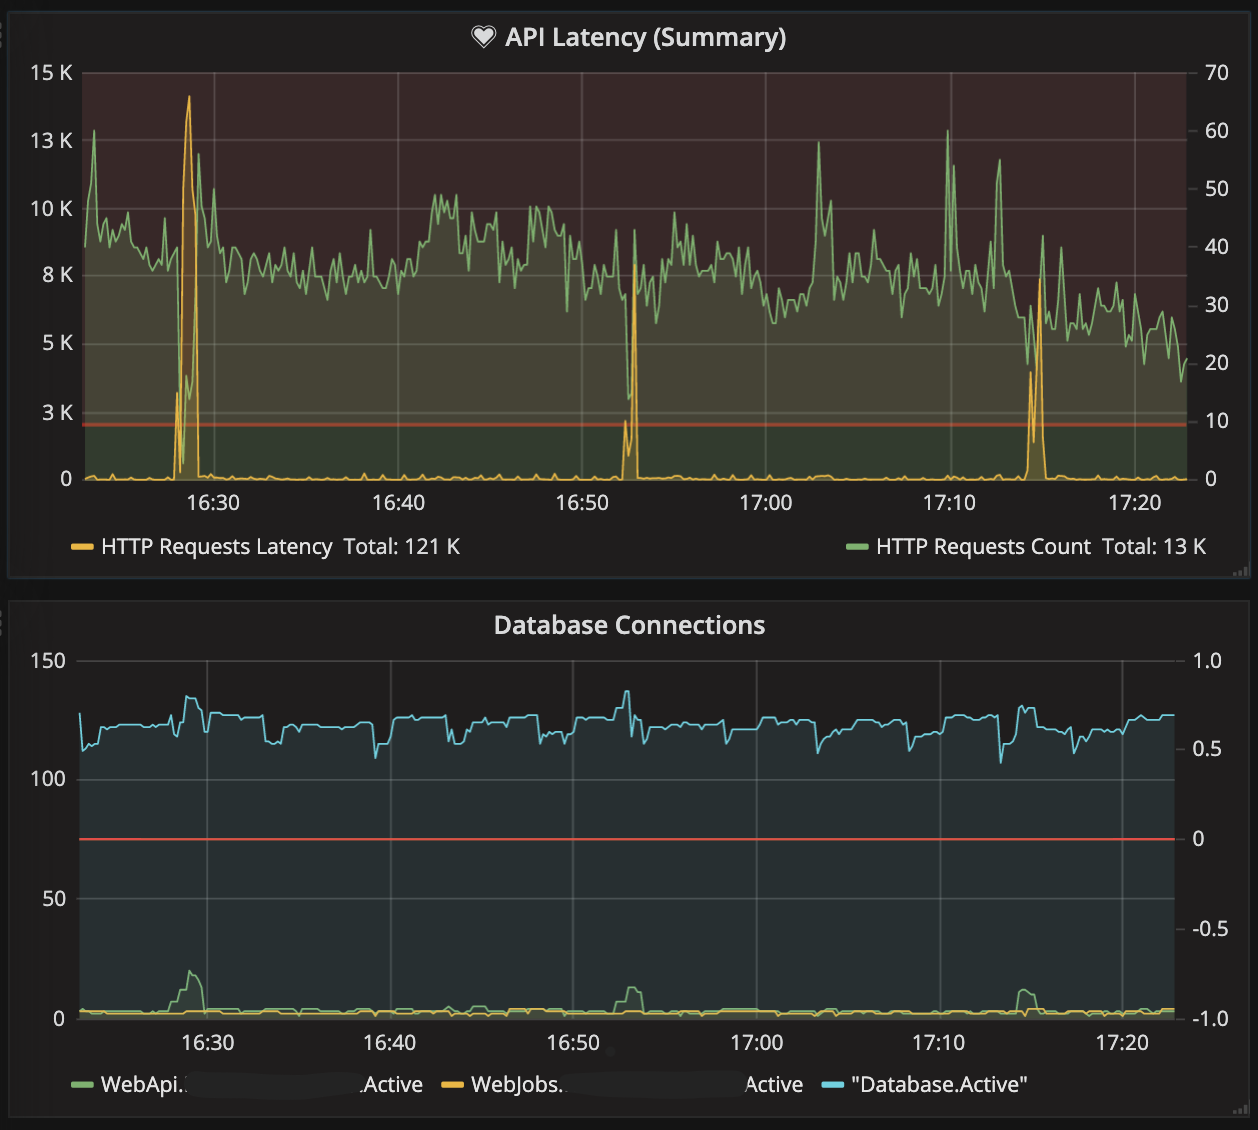
We also have an alternative source of telemetry which shows the same behavior. Our telemetry measures API latency and database metrics such as active connection count and pooled connection count (ADO.NET Connection Pool):

self monitoring confirmation

What is interesting, that every system stall is accompanied by a pooled connection quantity raise. And our tests show, the more connection pooled, the longer you spend waiting on a new connection from that pool to execute your next database operation. We analyzed a few suggestions but were unable to prove or disprove any of them:

  1. ADO.NET connection leak (all our db access happens in a using statement with proper connection disposal/return to pool)
  2. Socket/Port Exhaustion - where unable to properly track telemetry on that metric
  3. CPU/Memory bottleneck - charts shows there is none
  4. DTU (database units) bottleneck - charts shows there is none

As of now we are trying to identify the possible culprit of this behavior. Unfortunately, we cannot identify the changes which led to it becuase of missing telemetry, so now the only way to deal with the issue is to properly diagnose it. And, of course, we can only reproduce it in production, under permanent load (even when load is not high like 10 requests a second).

What are the possible causes for this behavior and what is the proper way to diagnose and troubleshoot it?

Zaccaria answered 4/10, 2019 at 5:59 Comment(2)
"And, of course, we can only reproduce it in production, under permanent load". Well, nothing (apart from time and money) stops you from building a second test instance of your environment that has the same specs as the production environment and apply an artificial load to it. The beauty of a controlled test environment is that you can vary the level of load to it to see how its behaviour changes with the load.Stere
we definitely should and will invest in load testing our staging to reproduce the issue there. For now we don't have issues reproducing it, we have issues approaching the problem.Zaccaria
Z
1

We ended up separating a few web apps hosted at a single App Service Plan. Even though the metrics were not showing us any bottle neck with the CPU on the app, there are other apps which cause CPU usage spikes and as a result Connection Pool Queue growth with huge Latency spikes.

When we checked the App Service Plan usage and compared it to the Database plan usage, it became clear that the bottleneck is in the App Service Plan. It's still hard to explain while CPU bottleneck causes uneven latency spikes but we decided to separate the most loaded web app to a separate plan and deal with it in isolation. After the separation the app behave normally, no CPU or Latency spikes and it look very stable (same picture as between spikes):

web api latency app service plan cpu usage

We will continue to analyze the other apps and eventually will find the culprit but at this point the mission critical web app is in isolation and very stable. The lesson here is to monitor not only Web App resources usage but also a hosting App Service Plan which could have other apps consuming resources (CPU, Memory)

Zaccaria answered 15/10, 2019 at 18:58 Comment(0)
F
2

There can be several possible reasons:

The problem could be in your application code, create a staging environment and re-run your test with profiler tool telemetry (i.e. using YourKit .NET Profiler) - this will allow you to detect the heaviest methods, largest objects, slowest DB queries, etc.Also do a load test on your API with JMeter.

I would recommend you to try Kudu Process API to look at the list of currently running processes, and get more info about them list their CPU time.

The article for how to monitor CPU using in Azure App service are shown below:

https://azure.microsoft.com/en-in/documentation/articles/web-sites-monitor/

https://azure.microsoft.com/en-in/documentation/articles/app-insights-web-monitor-performance/

Fiden answered 9/10, 2019 at 11:7 Comment(1)
thanks for the suggestions! We do use all kind of telemetry, Azure-based and own like profiler based, I can clearly see the CPU usage spikes but cannot explain how they cause the pooled connection queue size increase and not-gradual latency spike.Zaccaria
Z
1

We ended up separating a few web apps hosted at a single App Service Plan. Even though the metrics were not showing us any bottle neck with the CPU on the app, there are other apps which cause CPU usage spikes and as a result Connection Pool Queue growth with huge Latency spikes.

When we checked the App Service Plan usage and compared it to the Database plan usage, it became clear that the bottleneck is in the App Service Plan. It's still hard to explain while CPU bottleneck causes uneven latency spikes but we decided to separate the most loaded web app to a separate plan and deal with it in isolation. After the separation the app behave normally, no CPU or Latency spikes and it look very stable (same picture as between spikes):

web api latency app service plan cpu usage

We will continue to analyze the other apps and eventually will find the culprit but at this point the mission critical web app is in isolation and very stable. The lesson here is to monitor not only Web App resources usage but also a hosting App Service Plan which could have other apps consuming resources (CPU, Memory)

Zaccaria answered 15/10, 2019 at 18:58 Comment(0)

© 2022 - 2024 — McMap. All rights reserved.