How to see the execution plan of a multi-statement table valued function in SQL Server?
Asked Answered
P

1

6

I have a view in SQL Server that calls a function. When I show the actual execution plan for querying the view, what happens inside the function is completely opaque though.

As a small example, I made a function called MyFunction:

CREATE OR ALTER FUNCTION MyFunction 
    (@lower int, @upper int)
RETURNS @ReturnTable TABLE 
                     (
                         [Id] int,
                         [Value] int
                     )
AS 
BEGIN
    DECLARE @SomeTable TABLE 
                       (
                           [Id] int,
                           [Value] int
                       )

    INSERT INTO @SomeTable
        SELECT EE.Id, M.[ID, Bolag1]
        FROM DataModel.EconomicEstate AS EE
        LEFT OUTER JOIN DataModel.Metadata AS M ON M.[ID, Kstn] = EE.Id
        LEFT OUTER JOIN DataModel.Metadata AS M2 ON M2.[Period] = M.[Period]

    INSERT INTO @ReturnTable
        SELECT [Id], [Value]
        FROM @SomeTable
        WHERE [Value] >= @lower AND [Value] <= @upper

    RETURN
END

And a view called MyView that calls MyFunction:

CREATE OR ALTER VIEW MyView
AS
    SELECT *
    FROM MyFunction(200000, 400000)
GO

Next, I query the view:

SELECT 
    [Id], [Value]
FROM 
    [Test].[dbo].[MyView]

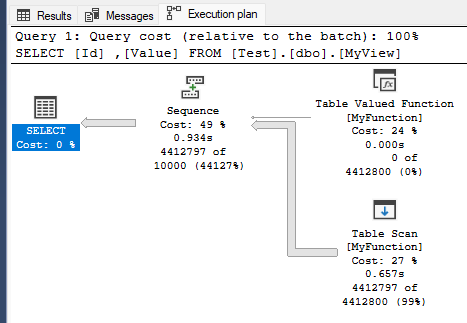
But in the actual execution plan, in SQL Server Management Studio, this is all I see:

Actual Execution Plan in SQL Server

Is it possible to dig deeper into MyFunction to see the performance it uses for joining the tables together? Can I somehow analyze the performance of a multi-statement table valued function?

Peril answered 10/3, 2023 at 8:48 Comment(17)
Interesting that the timings don't even seem correct either - that it took 0ms to insert 4.4 million rows into the table variable doesn't seem credible. I guess just have to assume 277 ms (934-657). I would just run it independently of the view. I think you would have to use some mechanism for gathering actual execution plans such as profiler or extended events otherwiseAppellee
Nothing in your function indicates you need it, why not just just do it in the view, or inline function if that's your game, this way you will see how the QP lookReferential
@MartinSmith The query took about 40 seconds to run, so I don't know why it says 0.934 seconds in the execution plan. How do I run the function independently of the view? If I just run the query SELECT * FROM MyFunction(200000, 400000), it shows the same execution plan without any details about what happens inside MyFunction.Peril
@Referential It's just a small example. My actual function, whose performance I want to diagnose, is much larger.Peril
Ok, then i think you're screwed :D If you enable SET STATISTICS IO ON; SET STATISTICS TIME ON; do you see anything?Referential
@Referential No, it prints very little additional information.Peril
If you move the function code to regular procedure with params, you should be able to see what it does, and it should be pretty much the same. Sure, there's some overhead and perhaps it's not as good at sniffing up the parameters but the query plans should be similar. I'm guessing it choses bad plansReferential
Ah I misremembered and thought selecting from it directly would give you a more informative plan. - you could just capture actual execution plans with an appropriate XEvent session techcommunity.microsoft.com/t5/sql-server-blog/… If it is taking 40 seconds then you can start the query off and run select * from sys.dm_exec_query_statistics_xml(session_id_of_other_session) in another window to see if that gives you the live planAppellee
That table function can't be inlined and has to be executed before the rest of the query can be processed. The performance is bad by definition. The optimizer for the outer query only knows it will receive a table variable with unknown statistics.Dieppe
Ah the unexpectedly low timings could be because of the Interleaved Execution feature with multi statement TVFs - so you only see the timings for the plan after the deferred compile.Appellee
which version of SQL Server?Bowsprit
Is your query using batch mode perhaps - in batch mode the timings are per operator, not cumulative.Cynar
This TVF can easily be replaced with an inline TVF. The two INSERT statements into the unindexed tables can be replaced with a single SELECT. More complex queries can be replaced with nested selects or CTEs, but this particular query could be a single SELECT with a WHEREDieppe
did you try OPTION (USE HINT('DISABLE_INTERLEAVED_EXECUTION_TVF'))Bowsprit
I noticed that behavior, too. Usually one can circumvent this problem by using "Display Estimated Execution Plan" (CTRL+L), which strangely enough displays what would happen inside the UDF, while the actual execution plan remains hidden.Baryta
SSMS won't be very helpful here, I'm afraid, since it won't show plan(s) for statements inside UDFs. Plans are compiled and cached on a per-statement basis, so for your UDF you can expect to find two plans (one for each insert statement) by way of sys.dm_exec_cached_plans and friends.Gracious
Can you enable "include live query statistics" in SSMS mssqltips.com/sqlservertip/7564/…Hypogenous
N
3

A tool such as SQL Sentry Plan Explorer can show more details than SSMS. It is free. (I do not work for SQL Sentry / SolarWinds, I just use their Plan Explorer a lot).

I used SQL Server 2017 Developer Edition for these tests and the latest Plan Explorer.

I have a table Numbers in my database with 1M rows with numbers from 1 to 1M. I used this test function, just to have something that takes some time to run:

CREATE OR ALTER FUNCTION MyFunction
    (@lower int, @upper int)
RETURNS @ReturnTable TABLE 
    ([Id] int,
    [Value] int)
AS
BEGIN
    DECLARE @SomeTable TABLE 
    ([Id] int,
    [Value] int)
    ;

    INSERT INTO @SomeTable
    SELECT N1.Number, N2.Number
    FROM
        dbo.Numbers AS N1
        CROSS JOIN dbo.Numbers AS N2
    WHERE
        N1.Number < 1000
        AND N2.Number < 100000
    ;

    INSERT INTO @ReturnTable
    SELECT [Id], [Value]
    FROM
        @SomeTable
        CROSS JOIN dbo.Numbers
    WHERE
        [Value] >= @lower AND [Value] <= @upper
        AND dbo.Numbers.Number < 100
    ;

    RETURN
END

And this query:

SELECT COUNT(*) FROM dbo.MyFunction(20, 50) AS T;

I used "Get Actual Plan With Live Query Profile" option:

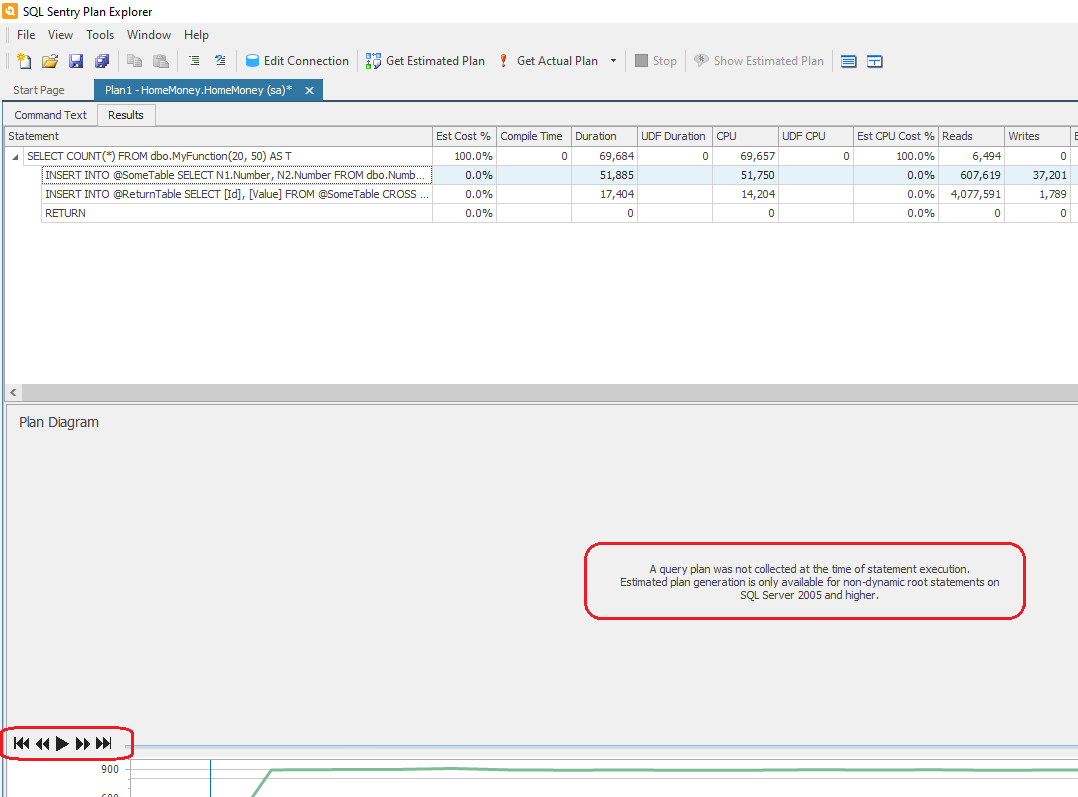
plan of the whole query

It showed the plan only for the main query, but it determined what was inside the function and showed durations and reads / writes / rows stats for each of the queries inside the function. This is already very useful.

When I select a query inside the function it sadly does not show its plan:

no plan for a query inside the function

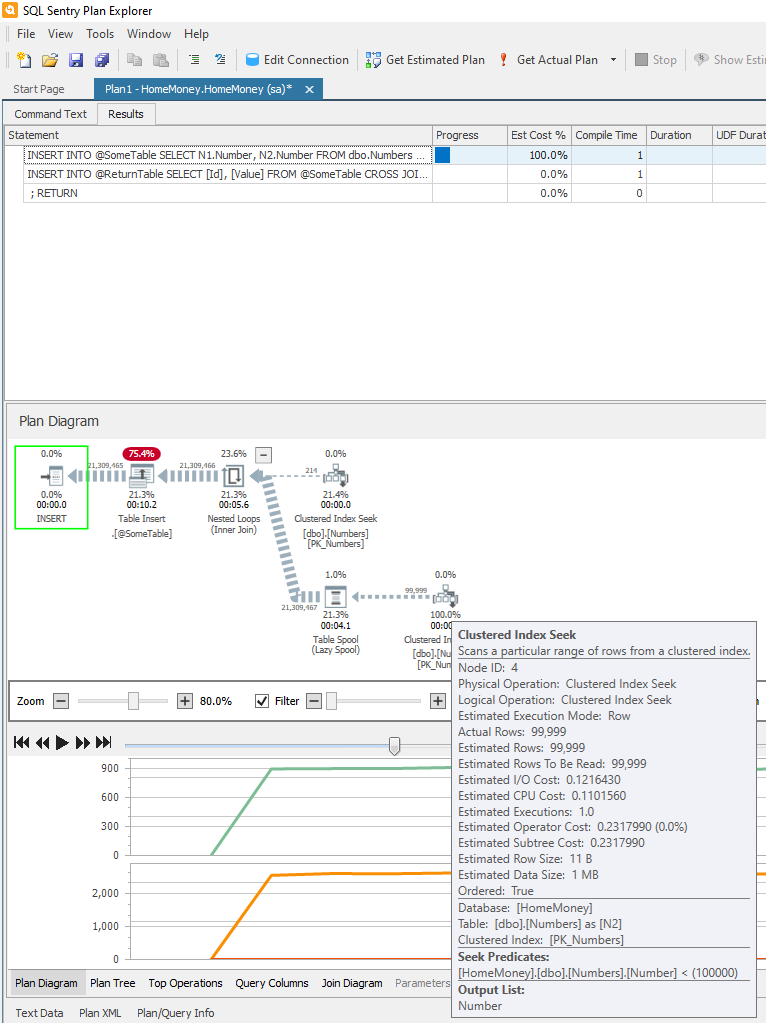
But, it is showing it during the query execution and when I click the "replay" button it shows it again. We can pause the replay and examine the plan as usual:

actual plan 1 of a query inside the function

actual plan 2 of a query inside the function

Neff answered 14/6 at 12:56 Comment(0)

© 2022 - 2024 — McMap. All rights reserved.